


We at Kaufman Hall do many interesting things. But among the most interesting is the publication of our monthly National Hospital Flash Report. We have the great fortune of receiving monthly financial information from hospitals throughout the country, which we translate into reports that summarize the financial status of the hospital industry on a monthly and an ongoing basis. The Flash Report has become the bible of macro hospital financial reporting and is relied on by hospitals, state hospital associations, and media outlets across the country.
While the Flash Report includes many charts and accompanying interpretative explanations, the chart that stands out over time is directly below.
This chart demonstrates the roller coaster ride of hospital financial results between the end of calendar year 2021 and the end of calendar year 2023.
U.S. Hospital YTD Operating Margin Index November 2021-December 2023
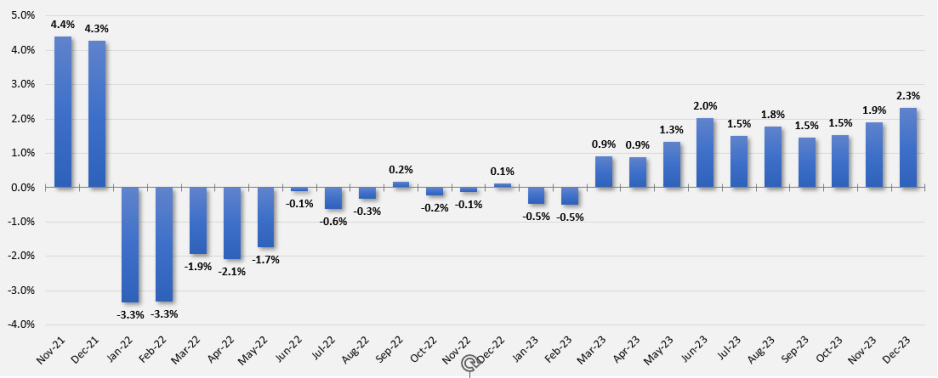
* Note: The Kaufman Hall Hospital Operating Margin and Operating Margin Index is composed of the national median of our dataset adjusted for allocations to hospitals from corporate, physician, and other entities.
The observations and questions from this chart are both interesting and required reading for hospital executives:
- Why were hospitals profitable at the 4% plus level through the worst of the 2021 Covid period?
- What exactly happened between December of 2021 and January of 2022 that resulted in a profitability decrease from a positive 4.2% to a negative 3.4%?
- Despite the best efforts of hospital executives, overall operating margins were negative throughout calendar year 2022 and did not return to positive territory until March of 2023.
- Hospital margins remained positive throughout 2023 and into 2024. However, overall margins have remained below those experienced in both 2021 and in the pre-Covid year of 2019.
The above questions and observations have proven interesting, and the ongoing numbers have proven quite useful in many quarters of healthcare. But recently I was talking with Erik Swanson, who is the leader of the Kaufman Hall Flash Report and our executive behind the data, numbers, and statistics. Erik and I were speculating about all of the above observations, but our key speculation was whether the 2023 operating margin results actually reflected a hospital financial turnaround or, in fact, were there “numbers behind the numbers” that told a different and much more nuanced story. So Erik and I asked different questions and took a much deeper dive into the Flash Report numbers. The results of that dive were quite telling:
- Too many hospitals are still losing money. Despite the fact that the Operating Margin Index median for 2023 and into 2024 was over 2%, when you look harder at the Flash Report data, you find that 40% of American hospitals continue to lose money from operations into 2024.
- There is a group of hospitals that have substantially recovered financially. Interestingly, the data shows over time that the high-performing hospitals in the country are doing better and better. They are effectively pulling away from the pack.
- This leads to the key question: Why are high-performing hospitals doing better? It turns out that several key strategic and managerial moves are responsible for high-performing hospitals’ better and growing operating profitability:
- Outpatient revenue. Hospitals with higher and accelerating outpatient revenue were, in general, more profitable.
- Contract labor. Hospitals that have lowered their percentage of contract labor most quickly are now showing better operating profitability.
- An important managerial fact. The Flash Report found that hospitals with aggressive reductions in contract labor were also correlated to rising wage rates for full-time employees. In other words, rising wage rates have appeared to attract and retain full-time staff which, in turn, has allowed those hospitals to reduce contract labor more quickly, all of which has led to higher profitability.
- Average length of stay. No surprise here. A lower average length of stay is correlated to improved profitability. Those hospitals that have hyper-focused on patient throughput, which has led to appropriate and prompt patient discharge, have also proven this to be a positive financial strategy.
- Lower financial performers have financially stagnated throughout the pandemic. The data shows that throughout the pandemic, hospitals with good financial results improved those results, but of more consequence, hospitals with poor financial performance saw that performance worsen. The Flash Report documents that the poorest financially performing hospitals currently show negative operating margins ranging from negative 4% to negative 19%. Continuation of this level of financial performance is not only unstainable but also makes crucial re-investment in community healthcare impossible.
- The urban hospital/rural hospital myth. A popular and often quoted hospital comparison is that there is an observable financial divide between urban and rural hospitals. Erik Swanson and I found that recent data does not support this common perception. When you compare “all rurals” to “all urbans” on the basis of average operating margin, no statistically significant difference emerges. However, what does emerge—and is a very important statistical observation—is that the lowest performing 20% of rural hospitals are, in fact, generating much lower margins then their urban counterparts this year. It is at this lowest level of rural hospital performance where the real damage is being done.
- Rural hospitals and obstetrics. The data does confirm one very important American healthcare issue: Obstetrics and delivery services are one of the leading money losers of all hospital service offerings. And the data further confirms that rural hospitals are closing obstetric departments with more frequency in order to protect the financial viability of the overall rural hospital enterprise. This is a health policy issue of major and growing consequence.
The point here is that data, numbers, and statistics matter both to setting long-term social health policy agendas and to the strategic management of complex provider organizations. But the other point is that the quality and depth of the analysis is an equally important part of the process. A first glance at the numbers may suggest one set of outcomes. However, a deeper, more careful and penetrating analysis may reveal critical quantitative conclusions that are much more telling and sophisticated and can accurately guide first-class organizational decision-making. Hopefully the analytics here are a good example of this very point.
Subscribe to Kaufman Hall’s monthly Flash Report
Note: The analysis in this blog post is based in part on data from the Kaufman Hall National Hospital Flash Report. The National Hospital Flash Report uses both actual and budget data over the last three years, sampled from more than 1,300 hospitals on a recurring monthly basis from Syntellis Performance Solutions, now part of Strata.