
Current Funding Environment
Not-for-profit healthcare debt issuance remains low. Overall municipal market issuance is now off only 1% versus 2022 but healthcare is still tracking around 53% lower; a central challenge remains credit headwinds across the sector. That said, recent issuances have generally met with solid reception although there can be material variation from one day to the next. Assessing options and distribution performance across potential funding channels remains an important capital structuring exercise.
| 1 Year | 5 Year | 10 Year | 30 Year | |
| Sep 22—UST | 5.46% | 4.57% | 4.44% | 4.52% |
| v. Aug 25 | +1 bps | +13 bps | +20 bps | +22 bps |
| Sep 22 –-MMD* | 3.45% | 3.12% | 3.16% | 4.07% |
| v. Aug 25 | +18 bps | +22 bps | +21 bps | +16 bps |
| Sep 22—MMD/UST | 63.2% | 68.3% | 71.2% | 90.0% |
| v. Aug 25 | +3.19% | +2.28% | +1.60% | -0.89% |
| *Note: MMD assumes 5.00% coupon | ||||
SIFMA reset this week at 4.31%, which is approximately 81.32% of daily SOFR* and represents a -16 basis point adjustment versus the August 23, 2023, reset.
*Daily SOFR quoted as of 9/21/2023 – 5.30%
Shifting into Neutral
On Wednesday, the Federal Reserve held rates constant, but noted the possibilities for an additional 25 basis point increase this year and for rates remaining higher for longer. In post-meeting comments, Chair Jerome Powell acknowledged that the U.S. economy remains stronger than expected—higher rates haven’t produced desired results—and shared several possible reasons for this, including:
- Household and business balance sheets were stronger than the Fed understood, which has allowed economic activity to remain robust despite higher rates.
- The “neutral rate” may be moving higher.
- Monetary policy may not have been restrictive enough for a long enough period.
Powell also noted some of the factors supporting his thesis that current policy is in the right place: his view that the still strong labor market is showing signs of coming back into balance; the progress on inflation; and the number of economists forecasting slower economic growth. Importantly, the state of play in labor and inflation is progress (not completion) and in economic growth is expected (not realized) slowing. So, the job isn’t done, and we’re not exactly sure where we are on the journey.
A few things to unpack. First, there has been a lot of chatter in the financial press around the “neutral rate,” which is the theoretical short-term rate that is neither accommodative nor restrictive (so it can support an economy at full employment with stable inflation). It is not a known or fixed level that can be managed as part of monetary policy, but rather more of a “know it when we see it” lagging indicator that shifts over time in response to an array of factors. As described in a Thursday Wall Street Journal article, prior to the 2008 credit crisis economists pegged the neutral rate in the 4%-4.5% range, but then it downshifted to around 2.5% by 2019, and now some are suggesting it may trend back towards 3.0%.
Different economists place different weight on the neutral rate, but the discussion around it matters to anyone running a balance sheet because it frames the question of what happens to monetary policy and benchmark rates after the inflation dislocation is resolved—does the Fed Funds rate head back toward 2.5% or does it settle at a higher level, such that when paired with a reversion to a normal, upward-sloping yield curve we wind up with structurally higher funding rates across the curve? The interesting challenge—which isn’t a part of any historical map that economists can consider—is the going in and coming out impact of all the post-2008 fiscal and monetary initiatives. U.S. federal debt increased from around $9.0 trillion in 2007 to $31 trillion in 2022, with another $2 trillion expected in 2023; similarly, the Fed balance sheet increased from around $900 billion in 2007 to $8 trillion in 2022, down from its $8.9 trillion peak. These are staggering levels of fiscal and monetary intervention, and it seems logical that any neutral rate would be heavily impacted by whether the Fed heads back to its pre-2008 role and how much federal debt markets must absorb. Put differently, is normal better represented by the 4.00%-4.50% of the pre-credit crisis era “influencer Fed” or the 2.50% era where the “interventionist Fed” emerged and unleashed its monster balance sheet?
The other noteworthy part of Powell’s comments is the observation that balance sheet strength has buffered consumers and businesses from some of the restrictive shock of higher rates. This seems to capture the recent not-for-profit healthcare experience. We’ve consistently advanced the thesis that healthcare organizations migrate along a resiliency versus return continuum as they move through different investment, business, or credit cycles. In a healthy cycle, resiliency (balance sheet reserves) might get strained because of a decision to invest in certain return (cash flow) accretive initiatives that, if successful, will not only recoup but eventually add to resiliency resources. The current challenge for healthcare—which is parallel to the one for consumers—is that resiliency is being eroded (balance sheets are being spent down) because inflation has decimated returns. What’s different is that consumers are trying to offset the impact by pursuing higher wages, whereas healthcare is bumping up against its very limited capacity to embed higher costs into the revenue side of the business model.
Recently released rating agency medians frame the point. Balance sheet resources (liquidity and debt capacity) are deteriorating, but more as an offset to historically weak margins than as part of investment initiatives designed to drive growth. In the Fed’s generic construct, once business or consumer balance sheet reserves fall far enough, economic activity slows (demand and growth shrink), inflation moderates, and a more balanced/workable return dynamic emerges. And this is the central challenge for healthcare: armed with a relatively brittle revenue model, the first line of defense remains spending down resiliency, but eventually the focus becomes whether, when, and how to restructure operations–either by increasing efficiency or contracting mission.
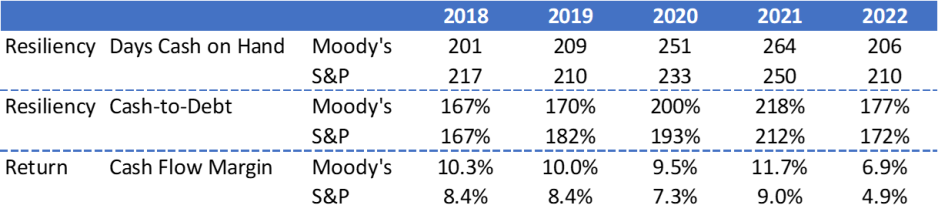
Sources: Moody’s Investors Service, Inc., and S&P Global Ratings
My colleague Lisa Goldstein got at this thread in her most recent blog on “Downgrades and the Rating Sword of Damocles.” All things being equal, ratings are grounded in the return side of the equation—the ability to generate sufficient cash flow to fund operations and capital, repay debt obligations, and add balance sheet reserves. But all things aren’t equal, which brings resiliency differentiation (aka, balance sheet strength) into the equation. Strong balance sheet reserves offer a longer runway for managing through return dislocation and the critical issue for every healthcare organization is how much can balance sheet get spent down before operating dislocation becomes the defining rating metric. The discussion must center on profitability, but it should extend to how balance sheet supports the transition from here to there. It’s always a resiliency-return conversation—what changes is the context.