
This week Federal Reserve Chairman Jerome Powell affirmed that the wind down in Quantitative Easing will accelerate while introducing the potential for three 0.25% rate hikes during 2022. This continues the remarkable shift in Fed policy as they try to zero in on the right policy response to inflationary pressures. It also highlights the problem with the “never done that before” journey the Fed has taken us on since the 2008 credit crisis: at best, there is no road map back home and at worst, we don’t know where home is anymore.
In thinking about what comes next, it is helpful to remember that capital structure analysis is grounded in statistics, and one of the pillars of statistical analysis is reversion to the mean, or the idea that over time an item being measured will revert to its average historical performance. Of course, this is terrifying for Chicago Cubs fans; but hope hinges on the possibility that some intervention (human or otherwise) offers an escape from the weight of statistical inevitability.
Looking at modern capital markets, the question is whether the Federal Reserve’s policies since December 2008 created a statistical breakpoint or whether they will prove to be blips in the longer trend. If the principle is reversion to the mean, what guide do you use when something occurs to fundamentally reset how a market works? A few point-in-time numbers help frame the issue in stark terms:
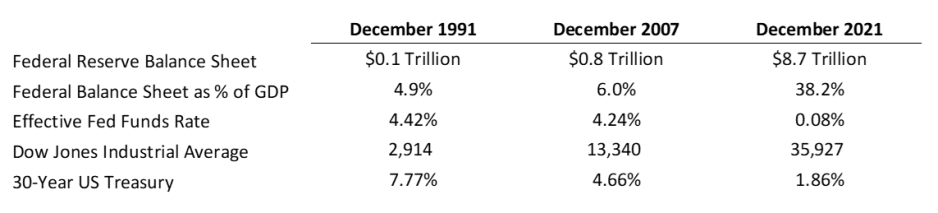
December 2008 marked the Federal Reserve’s introduction of the drug called Quantitative Easing into the U.S. capital markets. It started as a targeted strategy to help unlock certain funding markets, but it has ballooned into something that has transformed and distorted global financial markets. The unsettling questions we confront are: What is the “mean” that we might revert to (is it a non-Quantitative Easing world)? Will the Fed control the reversion or are there other forces that will influence events? How quickly will we revert? The work for healthcare providers is positioning resources in anticipation of the economic dislocation (across operations and balance sheets) that might accompany different scenarios.
The following sections offer perspective on the three pillars of capital structure management over four statistical periods:
- December 15, 2021: Where key rates and other indicators currently stand.
- December 15, 2008 to December 15, 2021: The last thirteen years, during which the Federal Reserve introduced Quantitative Easing into its market intervention playbook.
- December 15, 1991 to December 15, 2008: The prior seventeen years, during which the Federal Reserve relied primarily on the Fed Funds Rate to influence rates.
- December 15, 1991 to December 15, 2021: The past thirty-year horizon.
The variances between current levels versus averages during any measurement period are stunning.
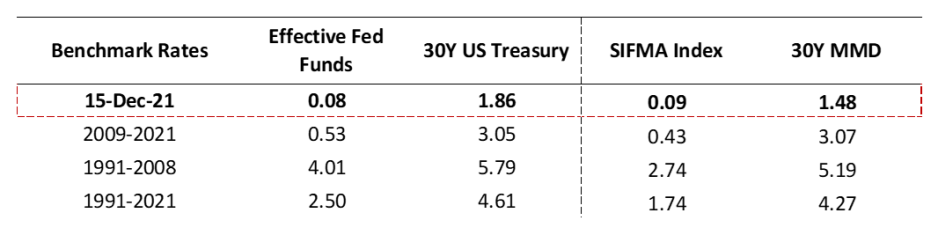
Benchmark Rates: When rates are low, the implied opportunity is to de-risk a capital structure by issuing long duration fixed rate debt. As rates transition, risk opportunities will re-emerge, and capital structure decision-making will become more complex.
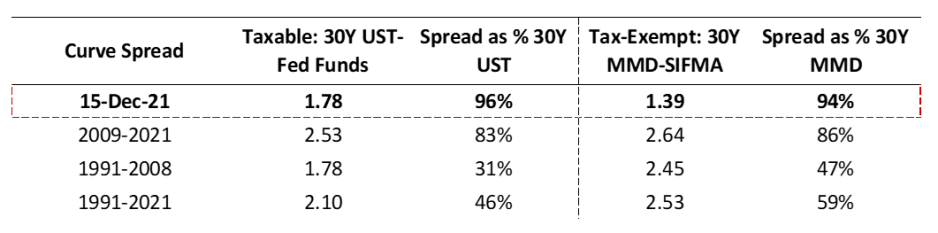
Curve Spread: When curves are flat and curve spreads as a percentage of long fixed rate levels are high, the capital structure guidance is to issue long duration fixed. As we move to higher rate environments, the probability is that curves will steepen, which will make floating rate options more compelling.
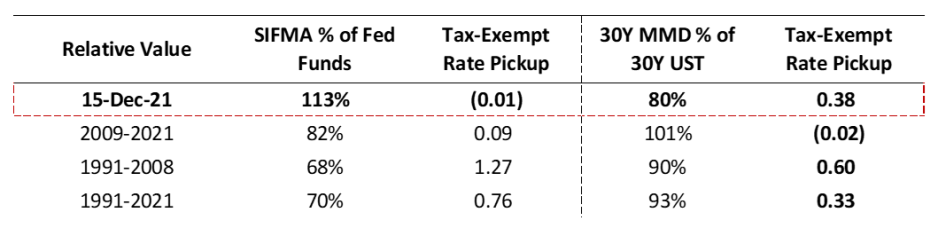
Relative Value: When tax-exempt to taxable ratios are low, issuing tax-exempt debt offers a lower cost, with the benefit dependent on absolute rate levels (the greatest value to tax-exemption is when rates are high, and ratios are low). A question as we transition to higher rates is how ratios will behave.
Capital structure decision-making is about risk transfer pricing and whether there is enough benefit from retaining capital structure risk versus other enterprise risk opportunities. Statistical analysis is an important decision support in this journey, but it is impossible for anyone right now to define what constitutes “normal” (aka the statistical mean). The response imperative is moving past transactional risk thinking and into a strategic framework in which risk capacity is a resource that is allocated across operations, strategy, or balance sheet in search of the right relationship between mission and returns.
This will be the last installment of this blog for 2021; expect the next installment on January 15, 2022. On behalf of all of us at Kaufman Hall, I hope each of you has a safe and restorative holiday season and a healthy, happy, and successful 2022. Every day we appreciate the opportunity to work alongside you in addressing the many different challenges we confront. We look forward to taking the fight to 2022.
Trending in Healthcare Treasury and Capital Markets is a biweekly blog providing updates on changes in the capital markets and insights on the implications of industry trends for Treasury operations, authored by Kaufman Hall Managing Director Eric Jordahl.