The inflation debate—transitory or structural—continues, but so far it doesn’t seem to be having much of an impact on rates. Long rates have moved higher in 2021 but the current 30-year Treasury is off its high mark of 2.45%. Heavier new issue supply has been absorbed with generally good participation and pricing. Inflation pressures are real, but the transitory side of the debate is taking comfort in things like stubbornly low labor participation rates and the idea that worker re-entry will moderate both wage pressures and supply backlogs. Even if they are right, it seems like it will take a while for labor dislocations to stabilize and longer still for technology or other solutions to emerge and allow organizations to start chipping away at the elevated cost structures. Pair this with the Fed’s stated plan to scale back asset purchases, and 2022 may offer three headwinds: credit pressures, long rate volatility, and a steepening yield curve.
|
1 Year |
5 Year |
10 Year |
30 Year |
|
|
Nov. 19 -Treasury |
0.16% |
1.20% |
1.54% |
1.91% |
|
v. Nov. 5 |
0.01% |
0.14% |
0.08% |
0.02% |
|
Nov. 19 – MMD* |
0.15% |
0.61% |
1.09% |
1.54% |
|
v. Nov. 5 |
0.00% |
-0.02% |
-0.04% |
-0.04% |
|
Nov. 19 – MMD/UST |
93.75% |
50.83% |
70.78% |
80.63% |
|
v. Nov. 5 |
-6.25% |
-8.60% |
-6.62% |
-2.97% |
|
*Note: MMD assumes 5.00% coupon |
||||
SIFMA reset this week at 0.04%, which is approximately 44.82% of 1-Month LIBOR and represents no basis point adjustment versus the November 3 reset.
The Balance Sheet You Need
I started working on Wall Street in June 1984. Paul Volcker was a little over halfway through his tenure as Chairman of the Federal Reserve. Around 1980 Volcker had initiated an epic tightening regime in a battle against inflation, pushing the Fed Funds Rate to over 20.00% (19.92% higher than where it stands today). By the time I showed up for my first day of work, the Fed Funds Rate had been lowered to 11.00% and the 30-year Treasury rate stood at 13.567%. No one thought the Volcker intervention was “normal,” but it turns out he was a piker compared to Bernanke, Yellen, and Powell.
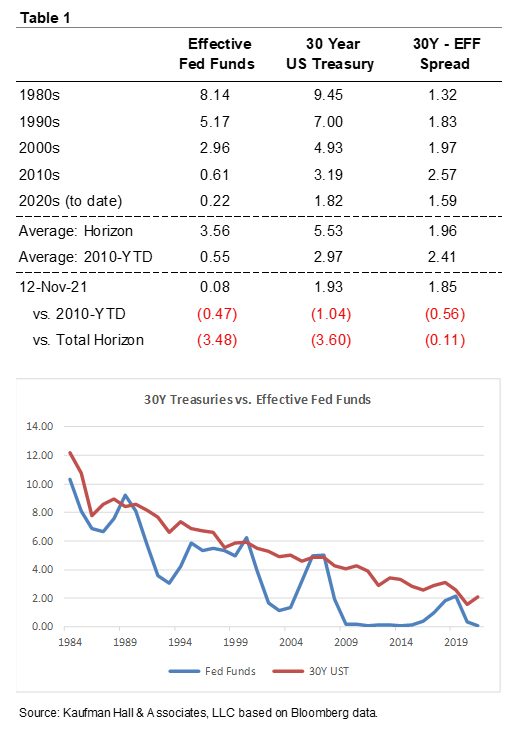
Table 1 and the chart to the right summarize my career in interest rates (with the 1980s starting June 1984). It is an amazing trend line and cumulative environmental change, but it also confirms some important ideas:
- The long-term average risk transfer premium (30-year fixed versus floating) is 196 basis points with significant divergences over the measurement period. The current curve spread of 185 basis points is higher than the recent trailing averages and is closer to the long-term average. This might suggest a return to a more balanced tolerance for new floating rate exposure, especially if the curve steepens further.
- But absolute rates across the entire yield curve remain at or near historical lows and are roughly 350 basis points below averages since June 1984. Assuming we shouldn’t design capital structures to anticipate negative long-term rates, the capital structure assumption must be that rates remain constant or trend higher. Status quo could be the interim normal but that will depend on three factors: the evolution of the broader “inflation as transitory or structural” debate; the Fed’s choices in balancing its price stability and employment mandates; and the market’s belief in what the Fed is doing. Virtually every scenario (rates flat to higher) leads back to a current bias to sell capital structure risk by transitioning to long-duration fixed, especially when full consideration is given to the amount of operating and strategic risk the typical healthcare provider will carry over the next several years.
In the September 25, 2021, email, we advanced the idea of developing a resource management plan that addresses both available and accessible resources. The interest rate context provided above, and the rate sea change that started in response to the 2008 credit crisis, reflect the fact that there is more liquidity available in the U.S. private and public capital markets than there has ever been before. The bad side of all this liquidity will emerge if it serves as the oxygen supply for damaging forces such as structural inflation or excessive leveraged risk. But the helpful side is the unprecedented opportunity to reposition balance sheet resources to get to the liquidity profile you need to drive operational and strategic success.
We are in a moment that offers important options ranging from de-risking traditional capital structures to monetizing, recapitalizing, or otherwise transforming an array of fixed asset resources (from real estate to energy plants to parking facilities). The form(s) of traditional-alternative leverage you introduce, the cost of achieving the right balance sheet, and how you think about and manage total diversified leverage versus equity will depend on the circumstances confronting your organization. What is consistent across every organization—regardless of size, credit rating, complexity, or any other defining characteristic—is the need to use this time to define, first, what responsive and integrated enterprise resource positioning means, and second, how to complete and sustain the transformation.
Please reach out to me by email ejordahl@kaufmanhall.com or phone at (224) 724-3134 with questions or if we can help in any way.
Trending in Healthcare Treasury and Capital Markets is a biweekly blog providing updates on changes in the capital markets and insights on the implications of industry trends for Treasury operations, authored by Kaufman Hall Managing Director Eric Jordahl.