Search Sort by Newest to OldestOldest to NewestRelevanceA-ZZ-A Pagination First page First Previous page ‹ Page 1 Current page 2 Page 3 … Next page › Last page Last The evolving rural primary care provider landscape Newly published projections from The Commonwealth Fund highlight persistent physician shortages, limited telehealth access and infrastructure and payment challenges in rural healthcare. Infographic Margins stabilize amid performance divide, while volumes rise The most recent National Hospital Flash Report highlights stabilizing hospital margins, with a persistent gap in hospital performance, according to September 2025 data. Infographic Docs exiting traditional Medicare in greater numbers The number of physicians exiting traditional Medicare has accelerated, especially since the Covid-19 pandemic, with the annual exit rate climbing from less than 1% in 2013 to nearly 5% in 2023, a new JAMA study has found. Infographic New AHA data quantify hospitals’ benefit to communities Tax-exempt hospitals provided nearly $150 billion in total community benefits in 2022, marking a nearly 50% increase from 2017, according to new data from the American Hospital Association. Infographic Hospital ownership of physician practices rising Hospital ownership of physician practices has grown significantly from 2008 to 2022, new data show. Infographic HOPDs treat sicker, more low-income and older patients: AHA study A recent study published by the American Hospital Association found that hospital outpatient departments (HOPDs) care for more complex patients than independent physician offices. Infographic Most U.S. adults want extension of ACA tax credits As Congress debates extending the enhanced advanced premium tax credits as part of broader spending bill negotiations, a new KFF poll shows overwhelming bipartisan support for keeping... Infographic Providers prevailing in No Surprises Act disputes Providers win the overwhelming majority of claim disputes under the No Surprises Act, prevailing 85% of the time in 2024, up from 81% in 2023, according to data recently published in Health Affairs. Infographic Healthcare uninsurance rates creeping up Newly published data from the U.S. Census Bureau indicate that the rate of uninsurance in the United States is rising. Infographic The rising cost of providing benefits to employees More than half of large employers intend to reduce benefits or shift costs to employees to control overall health plan costs, according to new data from Mercer. Infographic Behavioral health, neurosciences lead different-hospital readmissions One-third of discharged patients go to a different hospital when requiring a readmission, according to data from Vizient’s CMS Qualified Entity Public Report, published last month. Infographic Better outcomes for surgical patients A new report shows that the difference between expected and observed mortality rates for hospitalized surgical patients continues to improve. Infographic Pagination First page First Previous page ‹ Page 1 Current page 2 Page 3 … Next page › Last page Last
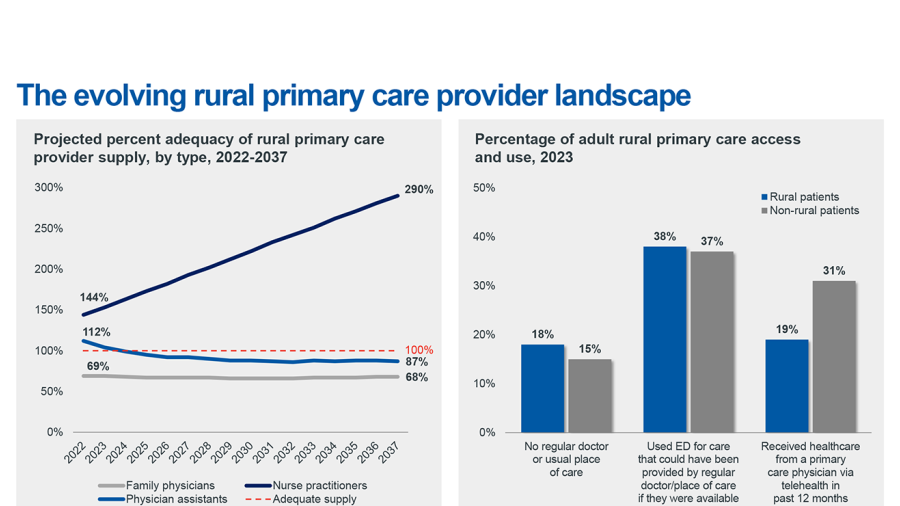
The evolving rural primary care provider landscape Newly published projections from The Commonwealth Fund highlight persistent physician shortages, limited telehealth access and infrastructure and payment challenges in rural healthcare. Infographic
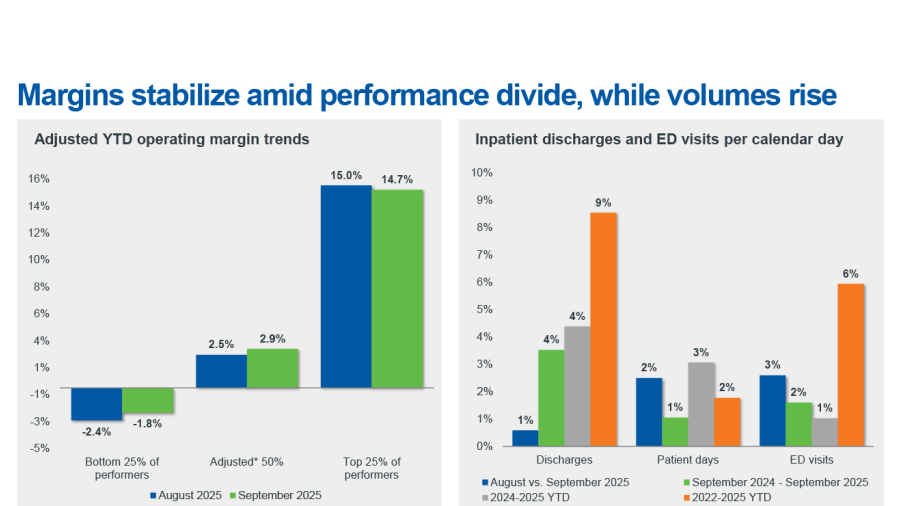
Margins stabilize amid performance divide, while volumes rise The most recent National Hospital Flash Report highlights stabilizing hospital margins, with a persistent gap in hospital performance, according to September 2025 data. Infographic
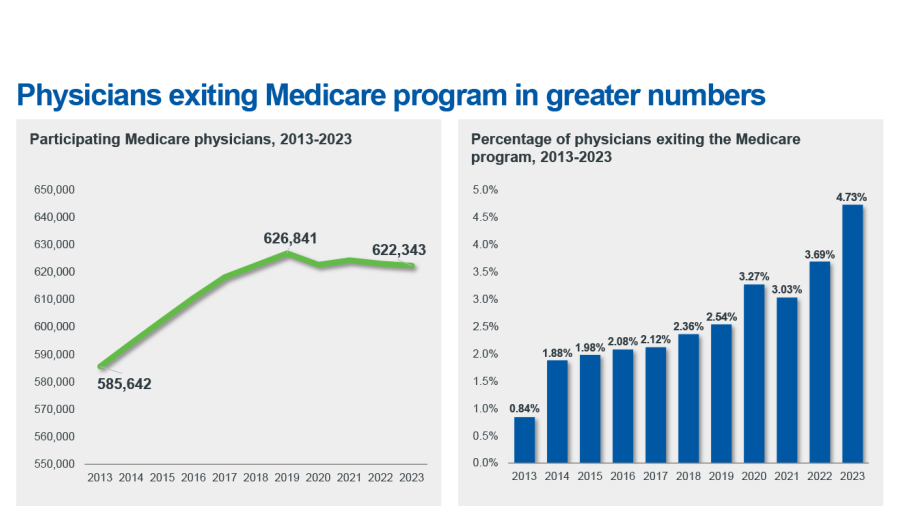
Docs exiting traditional Medicare in greater numbers The number of physicians exiting traditional Medicare has accelerated, especially since the Covid-19 pandemic, with the annual exit rate climbing from less than 1% in 2013 to nearly 5% in 2023, a new JAMA study has found. Infographic
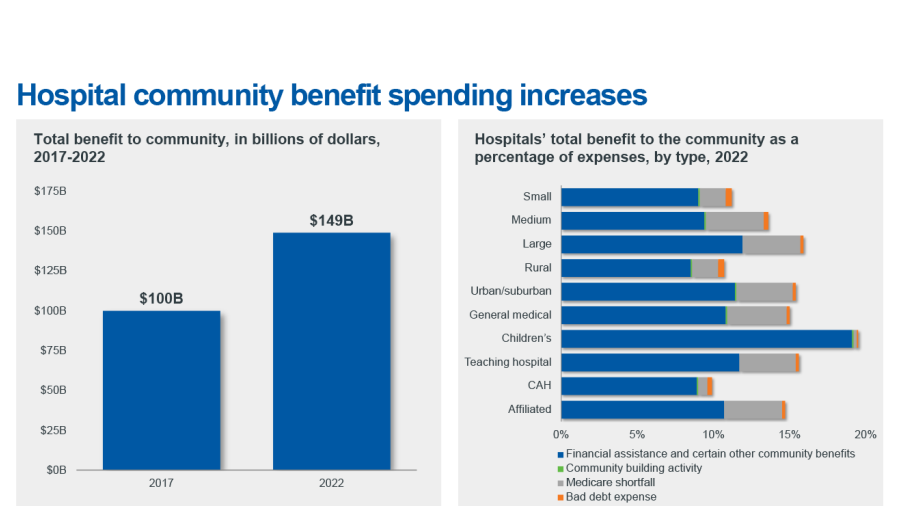
New AHA data quantify hospitals’ benefit to communities Tax-exempt hospitals provided nearly $150 billion in total community benefits in 2022, marking a nearly 50% increase from 2017, according to new data from the American Hospital Association. Infographic
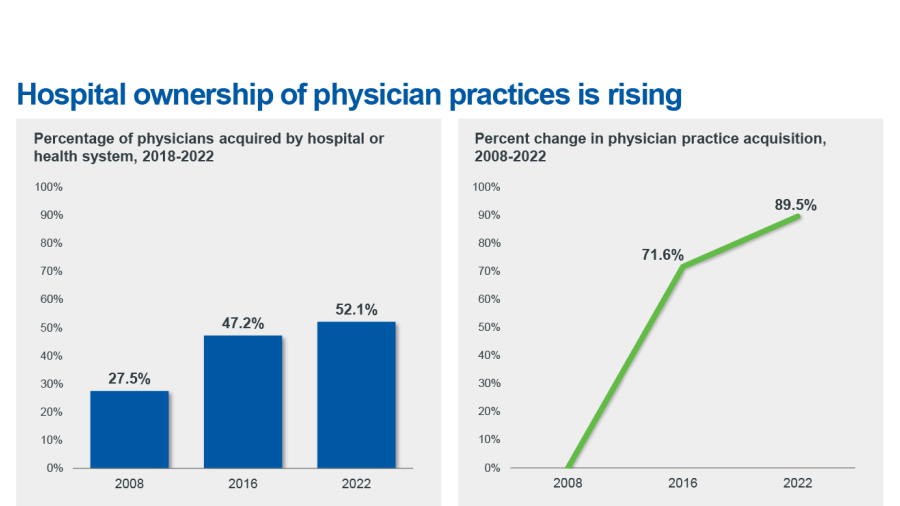
Hospital ownership of physician practices rising Hospital ownership of physician practices has grown significantly from 2008 to 2022, new data show. Infographic
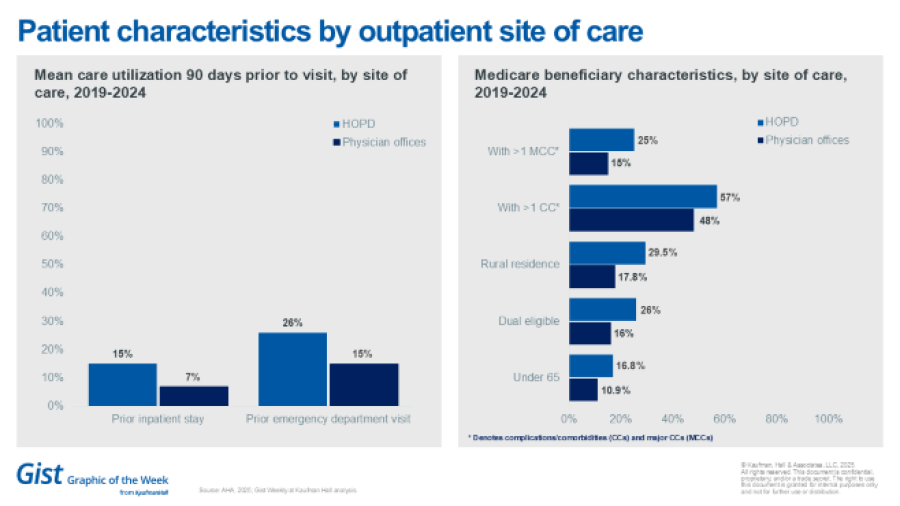
HOPDs treat sicker, more low-income and older patients: AHA study A recent study published by the American Hospital Association found that hospital outpatient departments (HOPDs) care for more complex patients than independent physician offices. Infographic
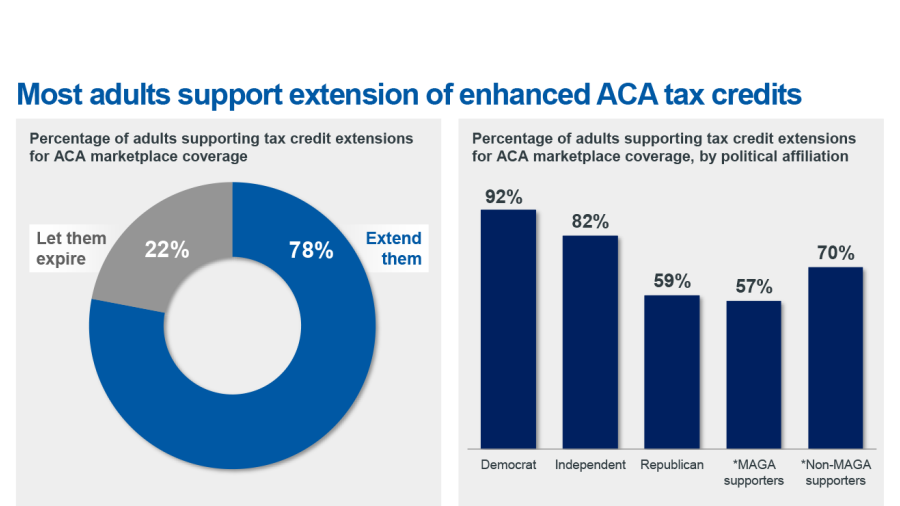
Most U.S. adults want extension of ACA tax credits As Congress debates extending the enhanced advanced premium tax credits as part of broader spending bill negotiations, a new KFF poll shows overwhelming bipartisan support for keeping... Infographic
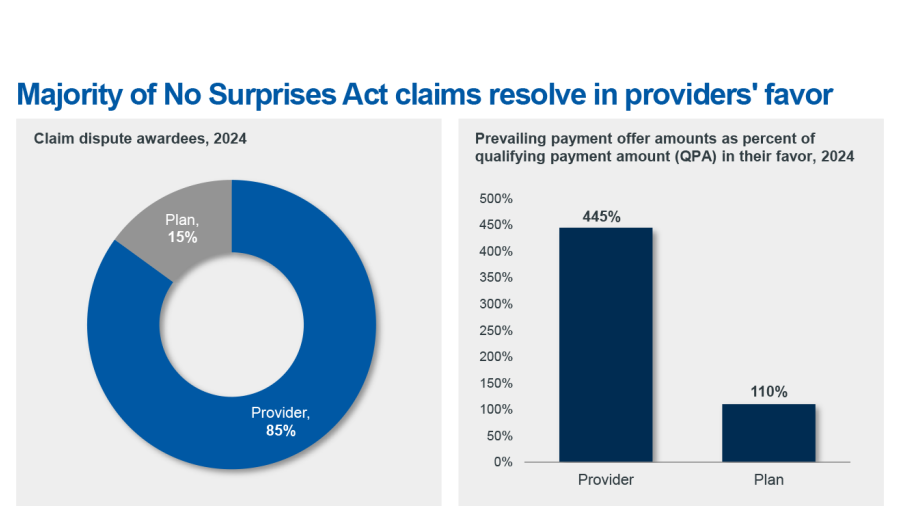
Providers prevailing in No Surprises Act disputes Providers win the overwhelming majority of claim disputes under the No Surprises Act, prevailing 85% of the time in 2024, up from 81% in 2023, according to data recently published in Health Affairs. Infographic
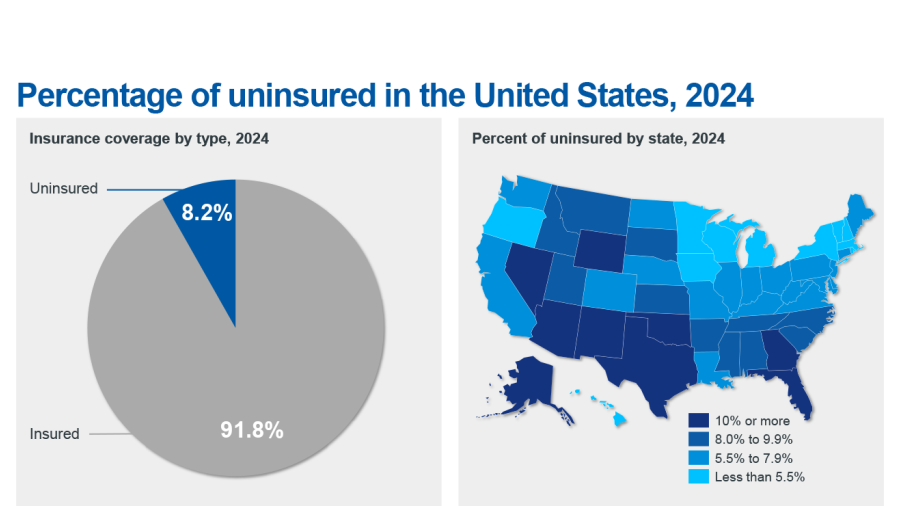
Healthcare uninsurance rates creeping up Newly published data from the U.S. Census Bureau indicate that the rate of uninsurance in the United States is rising. Infographic
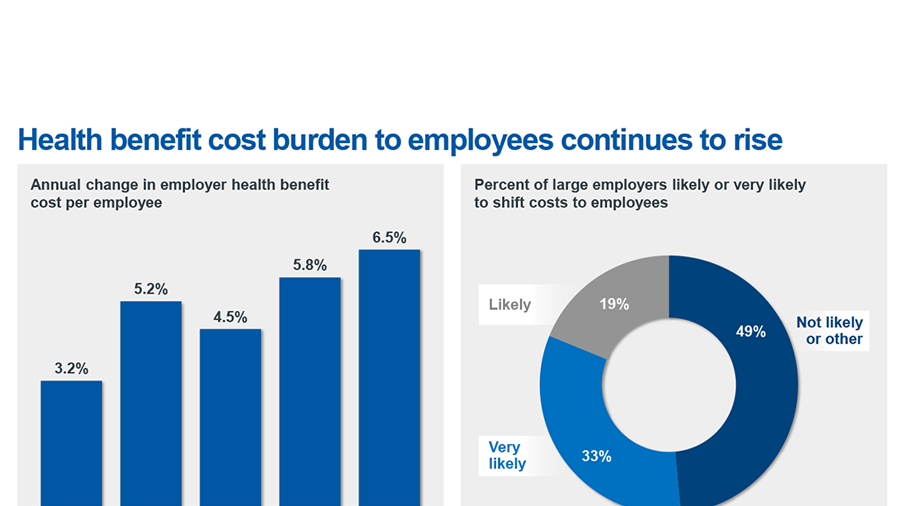
The rising cost of providing benefits to employees More than half of large employers intend to reduce benefits or shift costs to employees to control overall health plan costs, according to new data from Mercer. Infographic
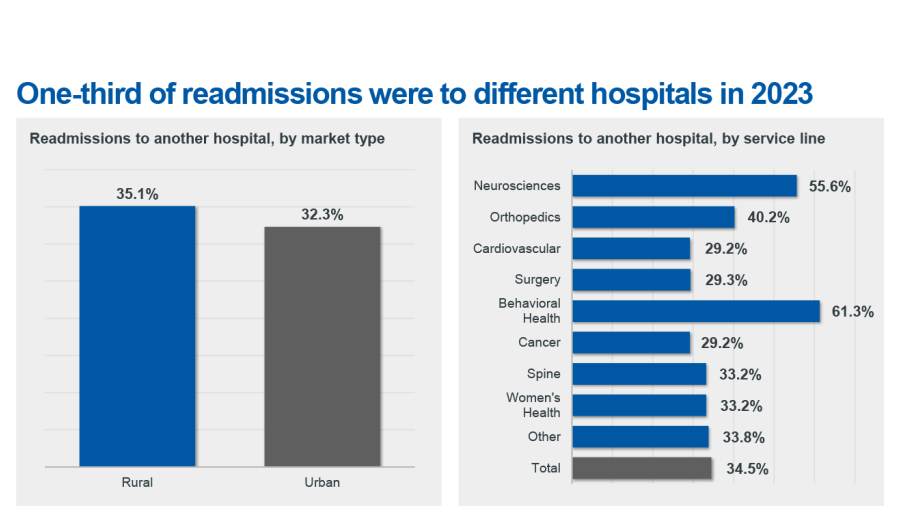
Behavioral health, neurosciences lead different-hospital readmissions One-third of discharged patients go to a different hospital when requiring a readmission, according to data from Vizient’s CMS Qualified Entity Public Report, published last month. Infographic
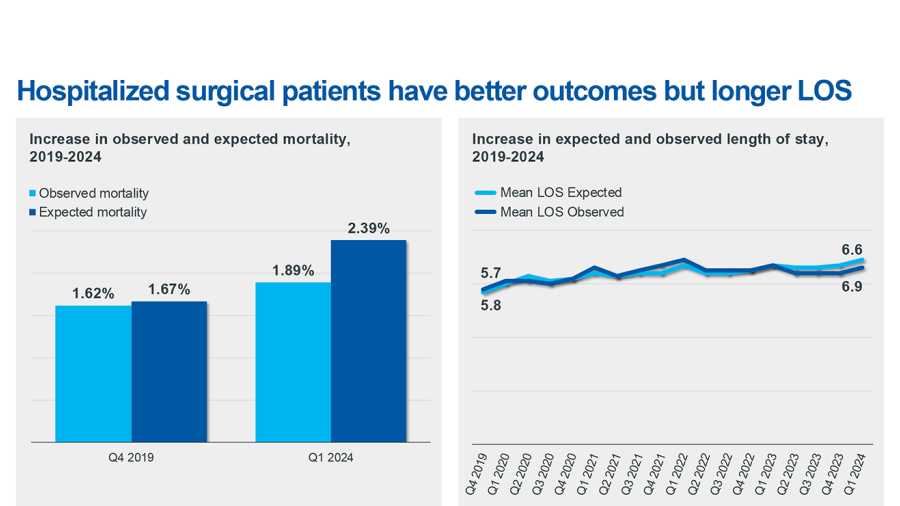
Better outcomes for surgical patients A new report shows that the difference between expected and observed mortality rates for hospitalized surgical patients continues to improve. Infographic