Search Sort by Newest to OldestOldest to NewestRelevanceA-ZZ-A Pagination First page First Previous page ‹ … Page 2 Current page 3 Page 4 … Next page › Last page Last High market concentration for Medicare Advantage insurers This week’s graphic features data from a new report from KFF highlighting how little competition there is in most markets for Medicare Advantage. Infographic Insights from the Vizient Spend Management Outlook This week’s graphic features data from Vizient’s Summer 2025 Spend Management Outlook, which provides a forward-looking analysis of product cost inflation for the 2026 calendar year. Infographic The role of immigrants on hospitals’ staffs This week’s graphic features data from a KFF analysis of how prevalent immigrants are in the hospital workforce. Infographic The steep cost of workplace violence in healthcare This week’s graphic features data from an American Hospital Association (AHA) report about violence in the healthcare workplace. Infographic A deep dive into state health scorecards This week’s graphic highlights a new report from The Commonwealth Fund with data on state-by-state health performance. Infographic Medicaid a prominent coverage provider among birthing parents In light of Medicaid cuts in the now-signed OBBB becoming law, this week’s graphic highlights a prominent use of Medicaid. Infographic Outpatient and complex inpatient care driving volumes through 2035 This week’s graphic features an analysis from the Impact of Change report published by Sg2, a Vizient company, earlier this week. Infographic Bipartisan worry about Medicaid cuts As the One Big Beautiful Bill Act makes its way through the Senate, this week’s graphic features new survey data from KFF on how the public currently feels about potential Medicaid cuts. Infographic Demographics behind youth firearm ED visits Demographics behind youth firearm ED visits Infographic Troubled times for a major payer This week’s graphic highlights UnitedHealth Group’s recent financial difficulties—which the large healthcare conglomerate did not fully anticipate. Infographic Intersection of performance improvement and health access This week’s graphic highlights Vizient Vulnerability Index (VVI) and procedure utilization data to show how utilization differs when certain socioeconomic factors are considered. Infographic Epic increases lead in electronic health record market This week’s graphic illustrates how Epic has continued to expand its lead in the electronic health record (EHR) market over its rival Oracle Health, which acquired Cerner in 2022. Infographic Pagination First page First Previous page ‹ … Page 2 Current page 3 Page 4 … Next page › Last page Last
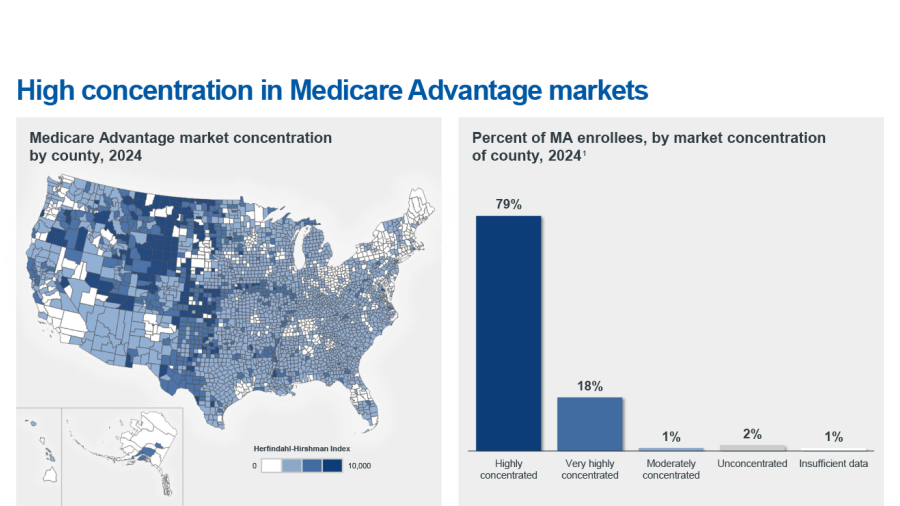
High market concentration for Medicare Advantage insurers This week’s graphic features data from a new report from KFF highlighting how little competition there is in most markets for Medicare Advantage. Infographic
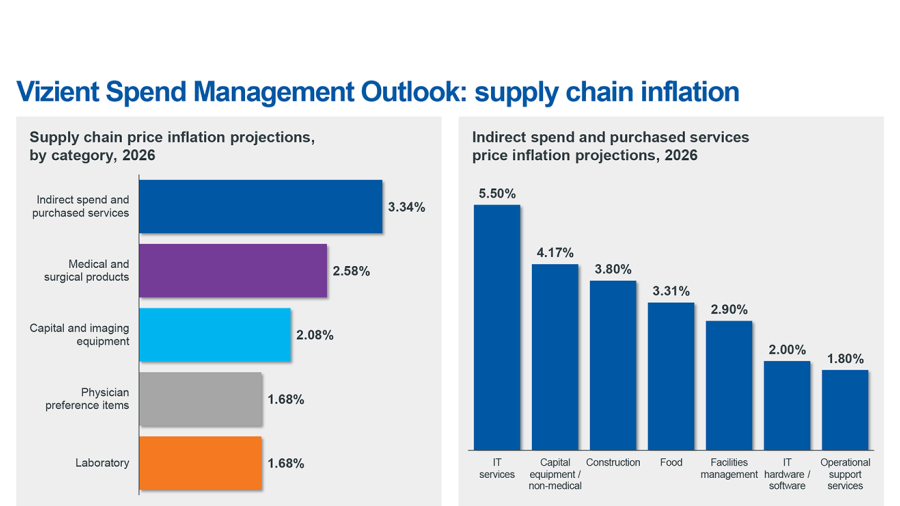
Insights from the Vizient Spend Management Outlook This week’s graphic features data from Vizient’s Summer 2025 Spend Management Outlook, which provides a forward-looking analysis of product cost inflation for the 2026 calendar year. Infographic
The role of immigrants on hospitals’ staffs This week’s graphic features data from a KFF analysis of how prevalent immigrants are in the hospital workforce. Infographic
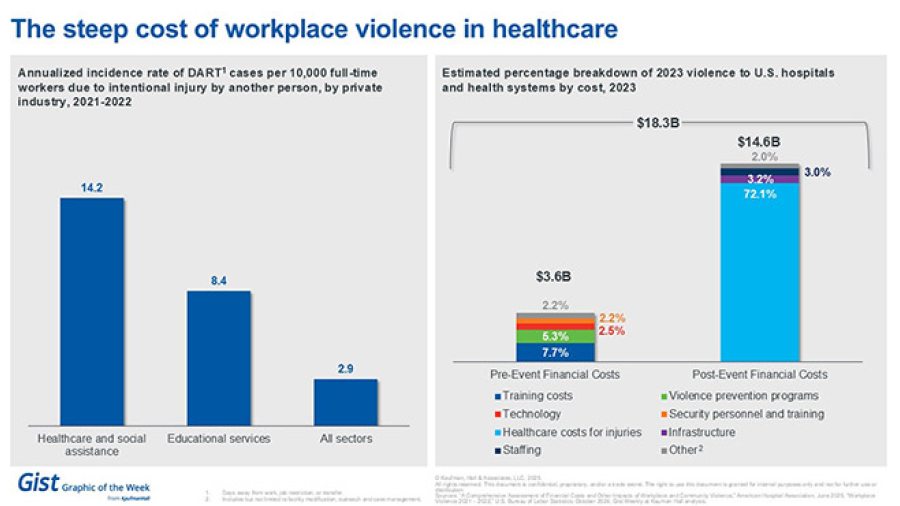
The steep cost of workplace violence in healthcare This week’s graphic features data from an American Hospital Association (AHA) report about violence in the healthcare workplace. Infographic
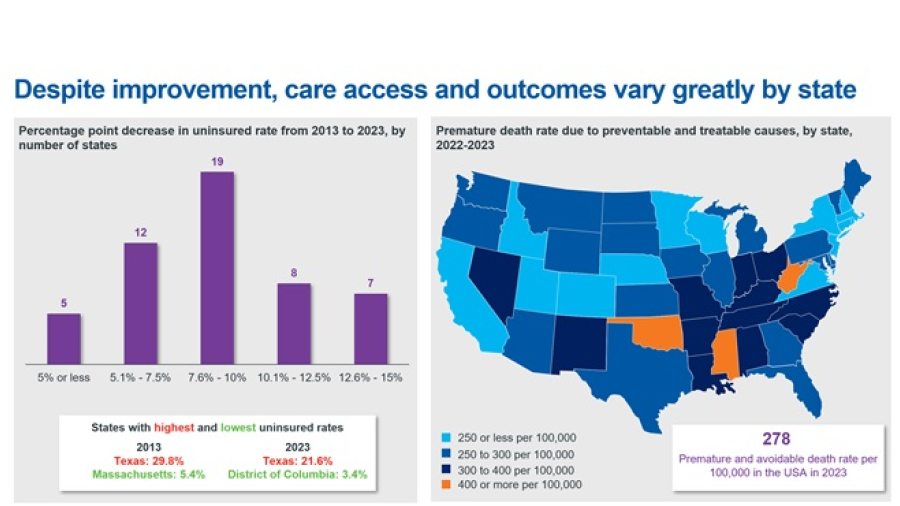
A deep dive into state health scorecards This week’s graphic highlights a new report from The Commonwealth Fund with data on state-by-state health performance. Infographic
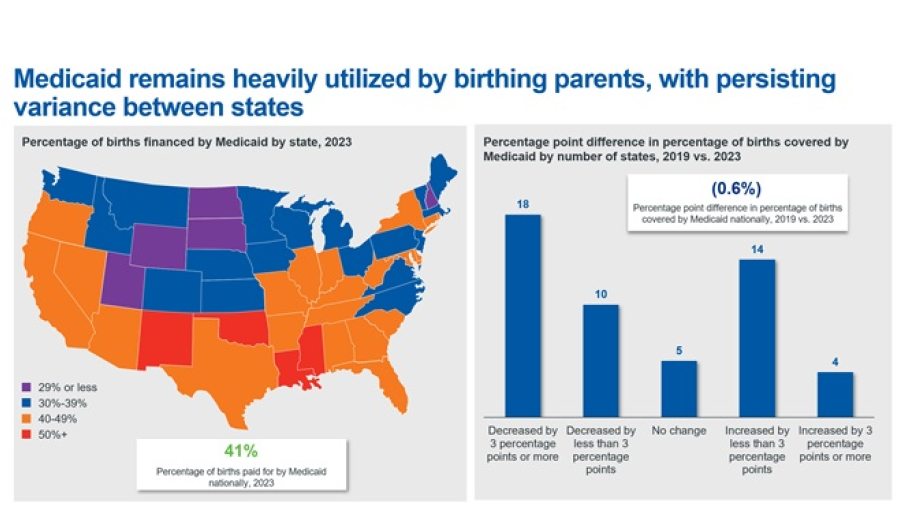
Medicaid a prominent coverage provider among birthing parents In light of Medicaid cuts in the now-signed OBBB becoming law, this week’s graphic highlights a prominent use of Medicaid. Infographic
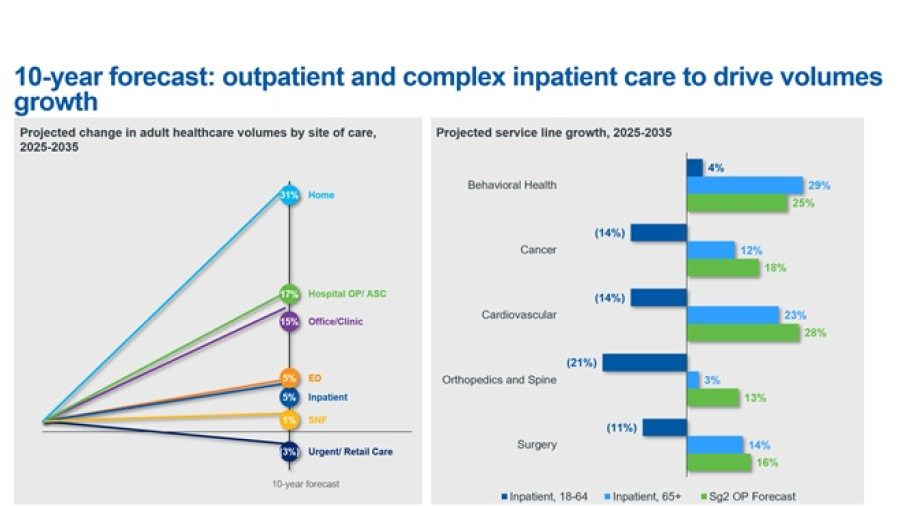
Outpatient and complex inpatient care driving volumes through 2035 This week’s graphic features an analysis from the Impact of Change report published by Sg2, a Vizient company, earlier this week. Infographic
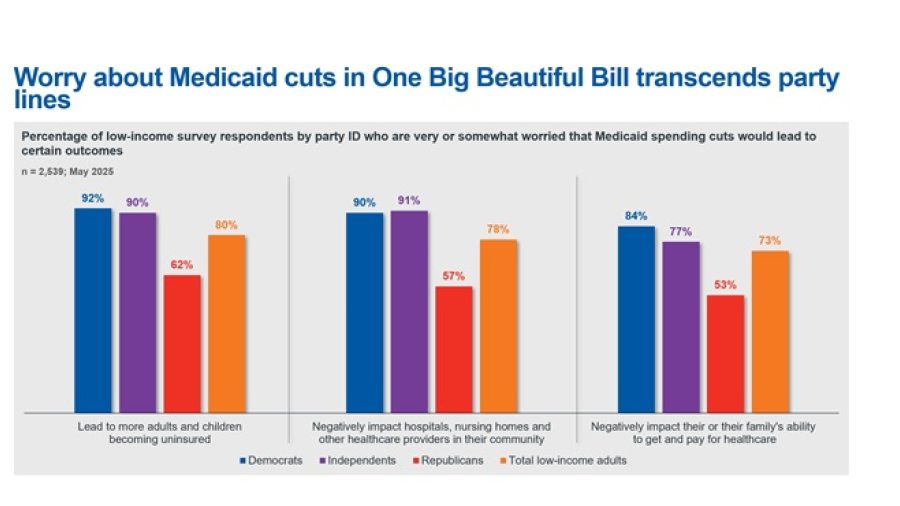
Bipartisan worry about Medicaid cuts As the One Big Beautiful Bill Act makes its way through the Senate, this week’s graphic features new survey data from KFF on how the public currently feels about potential Medicaid cuts. Infographic
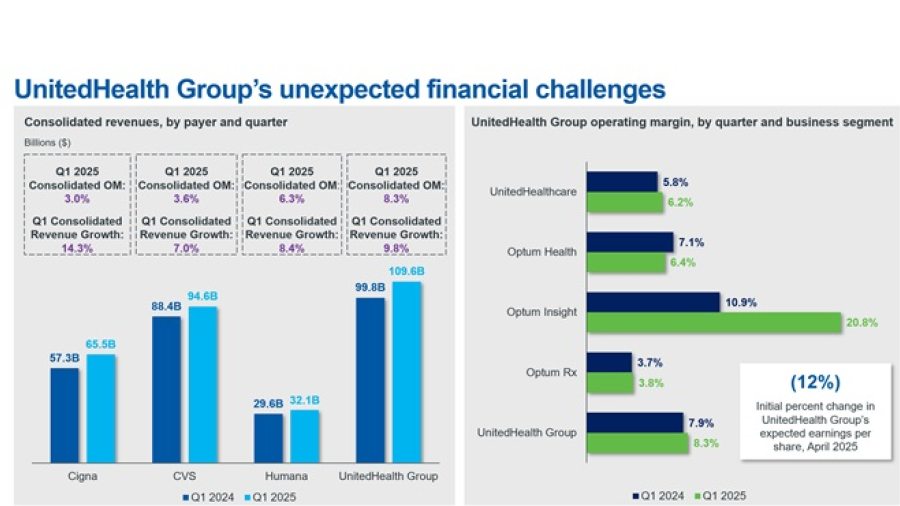
Troubled times for a major payer This week’s graphic highlights UnitedHealth Group’s recent financial difficulties—which the large healthcare conglomerate did not fully anticipate. Infographic
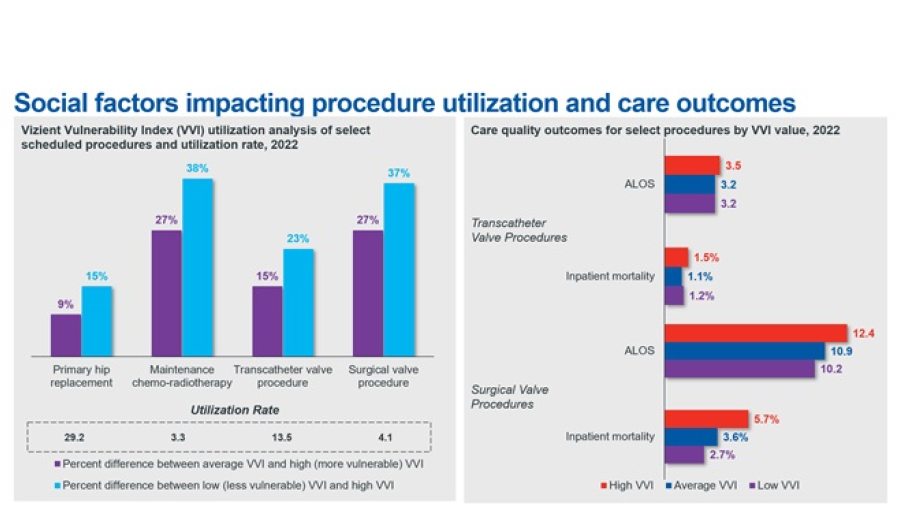
Intersection of performance improvement and health access This week’s graphic highlights Vizient Vulnerability Index (VVI) and procedure utilization data to show how utilization differs when certain socioeconomic factors are considered. Infographic
Epic increases lead in electronic health record market This week’s graphic illustrates how Epic has continued to expand its lead in the electronic health record (EHR) market over its rival Oracle Health, which acquired Cerner in 2022. Infographic