Search Sort by Newest to OldestOldest to NewestRelevanceA-ZZ-A The burden of health spending for working families As healthcare inflation continues to outpace overall inflation, American families are spending more on care and bearing that cost unevenly. Infographic Measles reaches record case counts since its elimination Last year, the United States experienced its worst measles outbreak in more than three decades, with more than 2,000 confirmed cases reported by the CDC across 49 outbreaks nationwide. Infographic Docs exiting traditional Medicare in greater numbers The number of physicians exiting traditional Medicare has accelerated, especially since the Covid-19 pandemic, with the annual exit rate climbing from less than 1% in 2013 to nearly 5% in 2023, a new JAMA study has found. Infographic High market concentration for Medicare Advantage insurers This week’s graphic features data from a new report from KFF highlighting how little competition there is in most markets for Medicare Advantage. Infographic Medicaid a prominent coverage provider among birthing parents In light of Medicaid cuts in the now-signed OBBB becoming law, this week’s graphic highlights a prominent use of Medicaid. Infographic Health Policy in the Second Trump Administration Following President Trump’s busy first few weeks in office, this week’s graphic takes stock of the president’s health policy actions to date. Infographic Rating Agencies Upgrade Not-for-Profit Hospital Outlook Congress scrambles for a new funding deal, a report details the financial impacts of a mandatory bundled payment model, and a woman receives a genetically modified pig kidney transplant. Infographic Assessing the Results of Medicaid Unwinding With the onset of the pandemic in March 2020, states were required to provide continuous enrollment for Medicaid and Children’s Health Insurance Program (CHIP) beneficiaries in exchange for enhanced federal funding. Infographic Disruption in the ESI market This week’s graphic dives into how individual coverage health reimbursement arrangements (ICHRAs), a relatively new coverage option, are being received in the market. Infographic Health Policy in a Non-Healthcare-Centric Election With Election Day less than six weeks away, this week’s graphic compares the positions of Vice President Harris and former President Trump on three of this cycle’s most important healthcare policy issues: competition, Medicare, and the cost of coverage. Infographic The State of American Medical Debt Amid increased bipartisan interest from policymakers on the nation’s increasing medical debt burden (estimated to total at least $220B), this week’s graphic examines who holds medical debt and how recent changes to credit reporting have affected them. Infographic Medicare Physician Payment Not Keeping Up Following the US Senate Finance Committee’s recent white paper on Medicare physician payment reform, the graphic shows how Medicare payments to physicians have not kept pace with inflation. Infographic
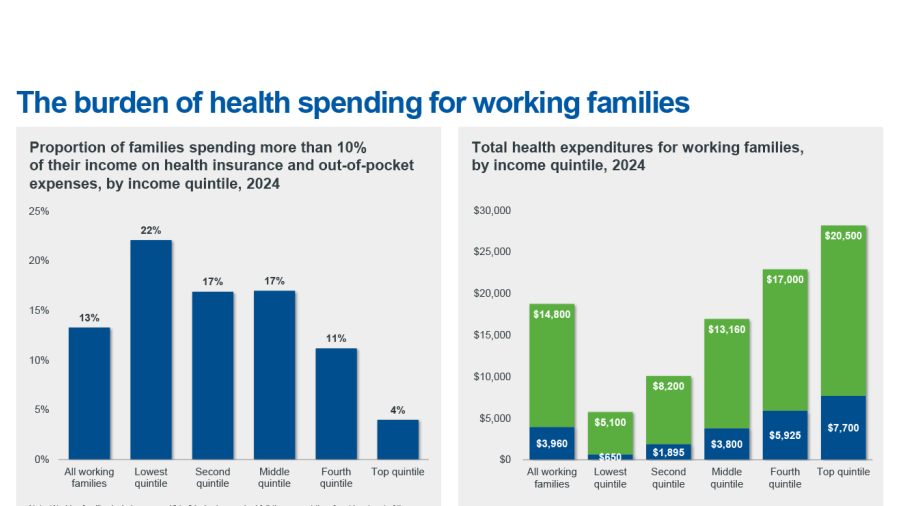
The burden of health spending for working families As healthcare inflation continues to outpace overall inflation, American families are spending more on care and bearing that cost unevenly. Infographic
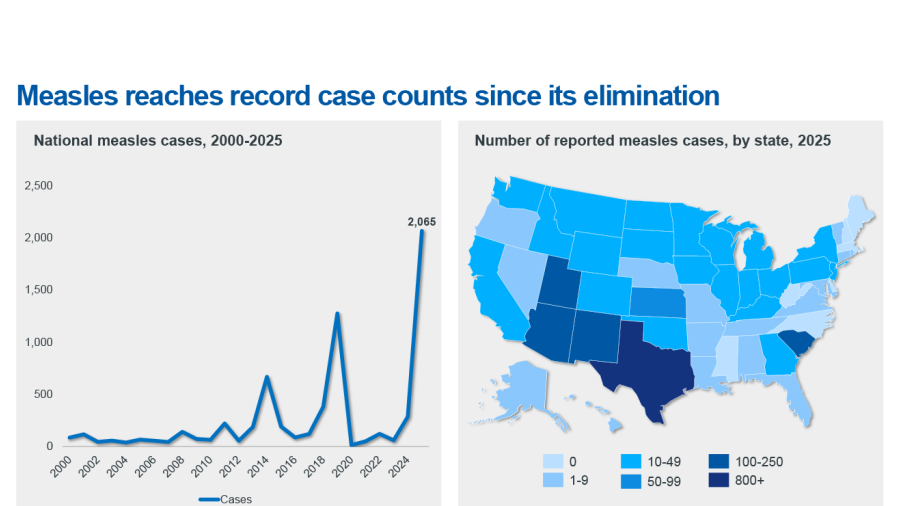
Measles reaches record case counts since its elimination Last year, the United States experienced its worst measles outbreak in more than three decades, with more than 2,000 confirmed cases reported by the CDC across 49 outbreaks nationwide. Infographic
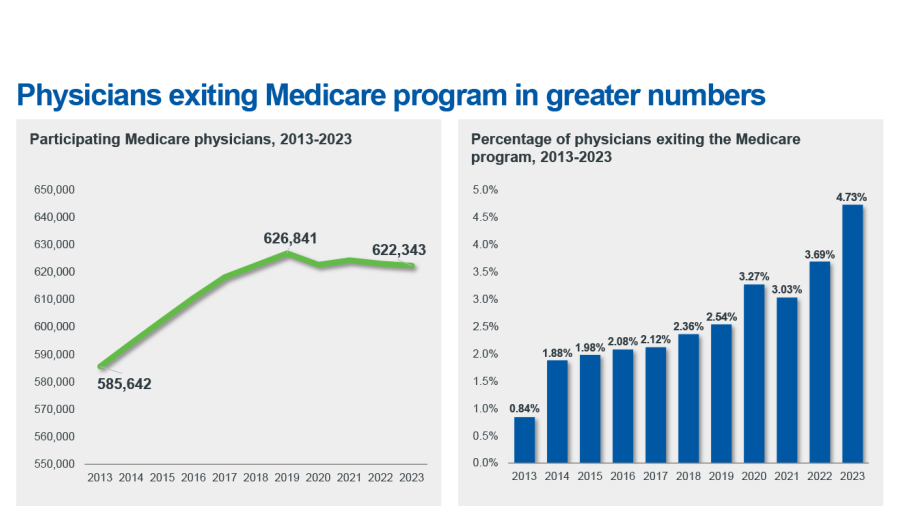
Docs exiting traditional Medicare in greater numbers The number of physicians exiting traditional Medicare has accelerated, especially since the Covid-19 pandemic, with the annual exit rate climbing from less than 1% in 2013 to nearly 5% in 2023, a new JAMA study has found. Infographic
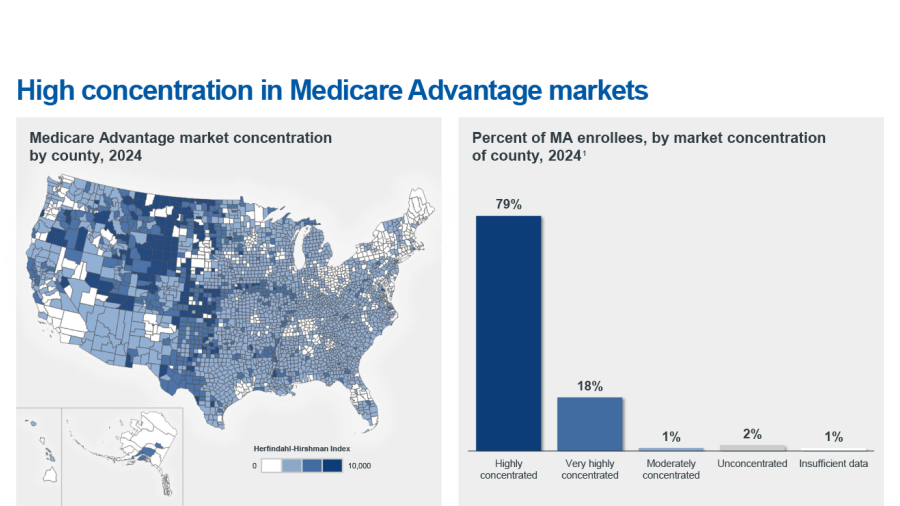
High market concentration for Medicare Advantage insurers This week’s graphic features data from a new report from KFF highlighting how little competition there is in most markets for Medicare Advantage. Infographic
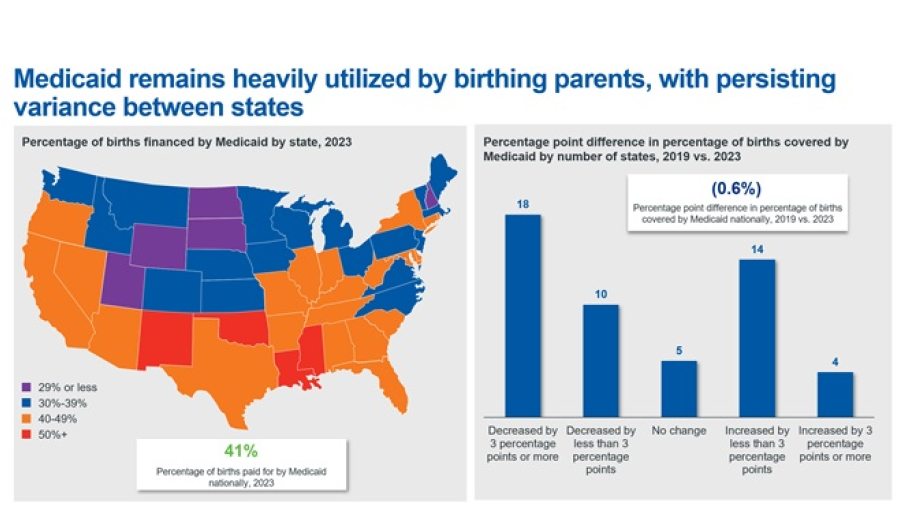
Medicaid a prominent coverage provider among birthing parents In light of Medicaid cuts in the now-signed OBBB becoming law, this week’s graphic highlights a prominent use of Medicaid. Infographic
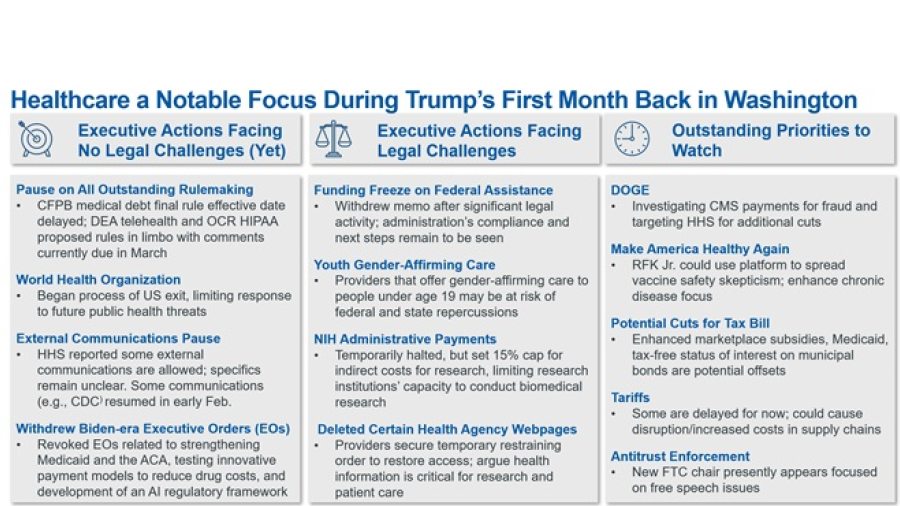
Health Policy in the Second Trump Administration Following President Trump’s busy first few weeks in office, this week’s graphic takes stock of the president’s health policy actions to date. Infographic
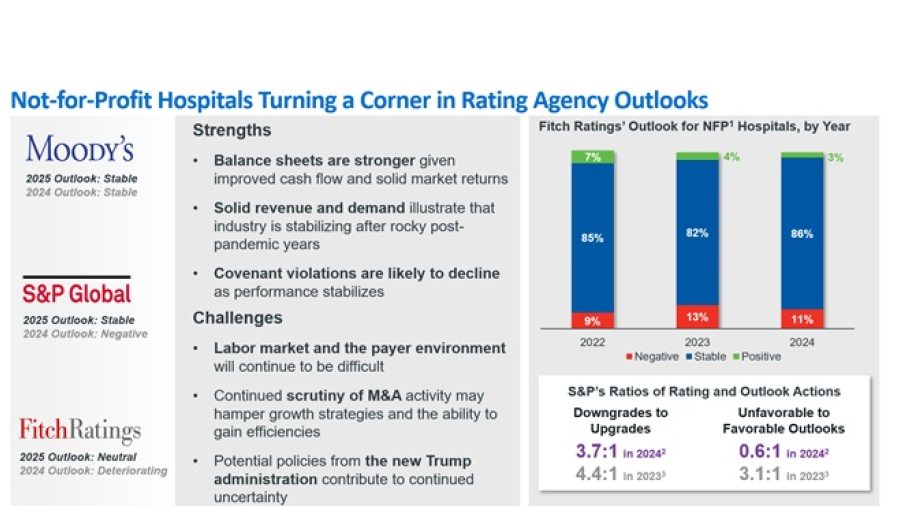
Rating Agencies Upgrade Not-for-Profit Hospital Outlook Congress scrambles for a new funding deal, a report details the financial impacts of a mandatory bundled payment model, and a woman receives a genetically modified pig kidney transplant. Infographic
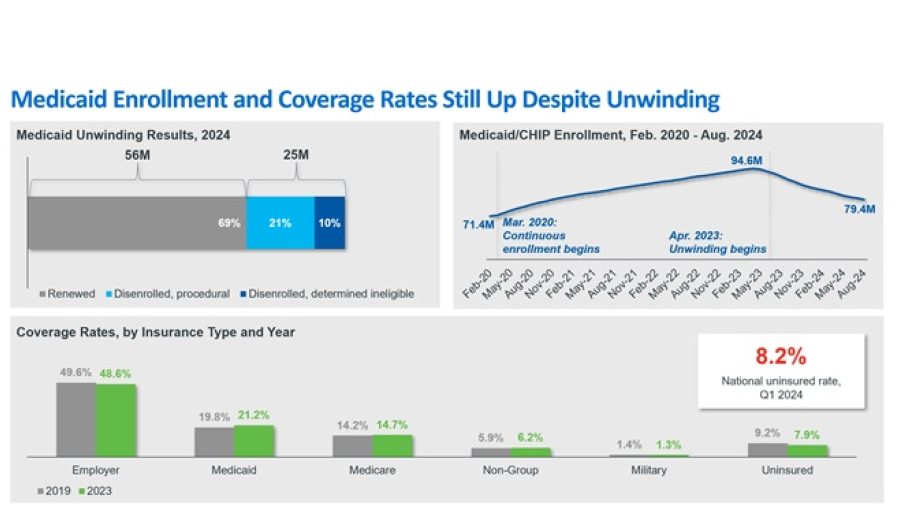
Assessing the Results of Medicaid Unwinding With the onset of the pandemic in March 2020, states were required to provide continuous enrollment for Medicaid and Children’s Health Insurance Program (CHIP) beneficiaries in exchange for enhanced federal funding. Infographic
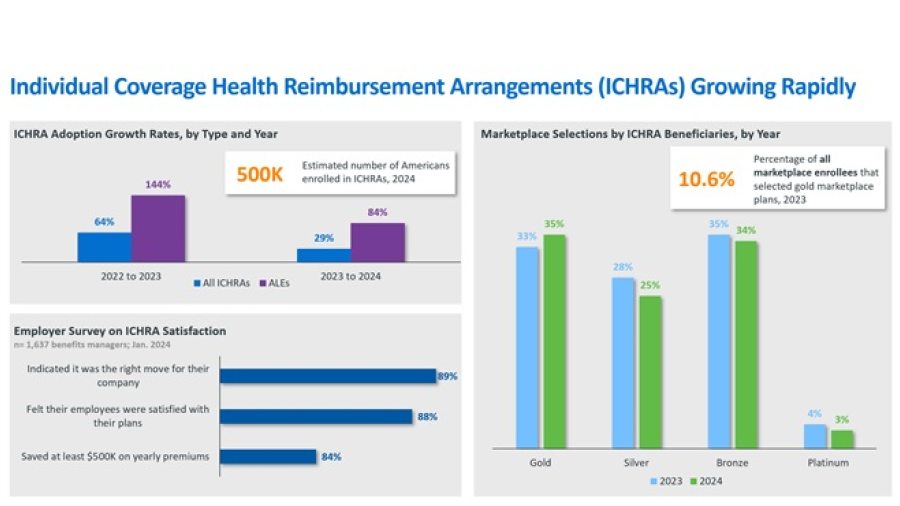
Disruption in the ESI market This week’s graphic dives into how individual coverage health reimbursement arrangements (ICHRAs), a relatively new coverage option, are being received in the market. Infographic
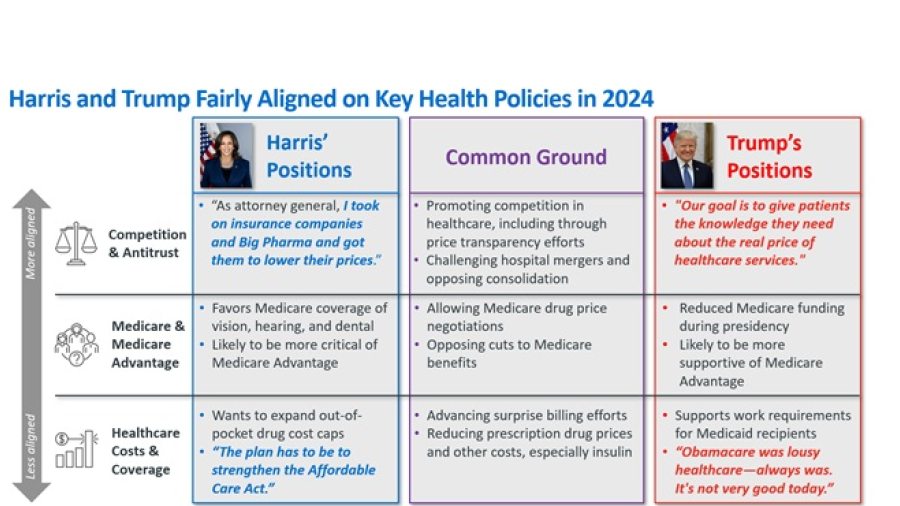
Health Policy in a Non-Healthcare-Centric Election With Election Day less than six weeks away, this week’s graphic compares the positions of Vice President Harris and former President Trump on three of this cycle’s most important healthcare policy issues: competition, Medicare, and the cost of coverage. Infographic
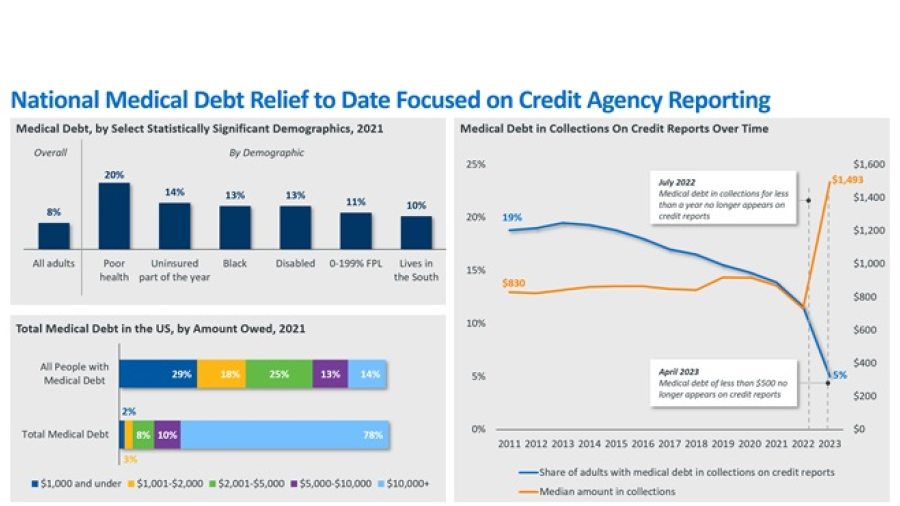
The State of American Medical Debt Amid increased bipartisan interest from policymakers on the nation’s increasing medical debt burden (estimated to total at least $220B), this week’s graphic examines who holds medical debt and how recent changes to credit reporting have affected them. Infographic
Medicare Physician Payment Not Keeping Up Following the US Senate Finance Committee’s recent white paper on Medicare physician payment reform, the graphic shows how Medicare payments to physicians have not kept pace with inflation. Infographic