The nation’s hospitals continue to face an uncertain operating environment, with margins fluctuating from month to month. Although September 2020 margins were above September 2019 levels, the Kaufman Hall median Operating Margin Index* stands well below last year’s performance at 2.7% year to date (YTD) through September with CARES funding, and -1.9% without CARES. The Kaufman Hall EBITDA Margin Index stands at 7.5% YTD with CARES funding and 3.2% without CARES, also well below 2019 YTD levels.
The rise in September margins in year-over-year (YOY) comparisons with September 2019 occurred despite lower volumes for a seventh consecutive month. In September, Operating Margin rose 8.1% YOY and was 7.8% above budget without CARES relief. With CARES, Operating Margin rose 15% YOY and 12.2% above budget. Operating EBITDA Margin rose 2.9% YOY and 4% above budget without CARES, and 5.4% YOY and 5.8% above budget with the federal aid. But Discharges were down 9.9% YTD and 5.6% YOY.
Several factors contributed to the rise in margins amid suppressed volumes. Average Length of Stay (LOS) continued to increase, rising about 2.3% YTD and YOY. The rise in LOS contributed to an increase in payment per case with Net Patient Service Revenue (NPSR) per Adjusted Discharge up 5.8% YTD and 10.7% YOY and NPSR per Adjusted Patient Day up 4.1% YTD and 9.4% YOY. Organizations also are benefitting from the 20% Medicare COVID-19 add-on, suspension of the -2% sequestration adjustment, and lower bad debt—all of which are helping to drive revenue.
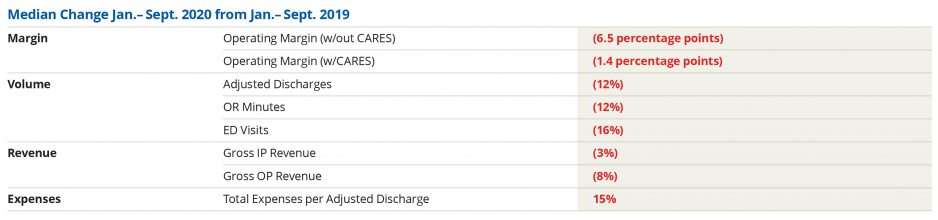
Higher revenues were offset by a rise in Total Expense, which increased 1.8% YTD and 3.5% YOY. Total Non-Labor Expense was up 5.1% YOY and Non-Labor Expense per Adjusted Discharge rose 14.4% as LOS and outpatient activity increased, and hospitals continued to purchase personal protective equipment and other supplies for safe operations. Total Labor Expense increased 1.2% YOY and Full-Time Equivalents (FTEs) per Adjusted Occupied Bed (AOB) rose 0.9% YOY as many hospitals began to bring back furloughed workers.
Operating Room Minutes showed some recovery, rising 3.6% YOY as hospitals continued to push through a backlog of cases. Even so, Operating Room Minutes were down 12% YTD, reflecting the impact of COVID-related delays or cancellations of care. Consumers continued to avoid emergency departments, with Emergency Department Visits falling 19.1% YOY and 16.4% YTD in September.
In the broader economy, stalled economic stimulus discussions and continuing coronavirus flare-ups created tumult in the equity markets, with the S&P 500 falling 3.9%. Meanwhile, the domestic unemployment rate decreased to 7.9%—its lowest level since April—and consumer confidence rose to 101.8%, reflecting recovery in public perceptions of domestic business and labor market conditions.
Hospitals find themselves in a tenuous situation as they continue to perform well below last year on a YTD basis. Earlier issues of the National Hospital Flash Report noted that postponements or cancellations in care were primarily due to consumer behavior rather than social distancing mandates. Looking ahead, consumer behavior could be impacted greatly as rising COVID-19 cases collide with the seasonal flu, again leading many to avoid hospitals. The results could be hugely detrimental to overall public health and to hospitals’ financial well-being.
Our data show that the pandemic’s impacts and recovery are highly variable for hospitals of different sizes and across different regions, with some weathering the storm better than others. Organizations must prepare to repay Medicare Accelerated Payments and any paycheck protection funding used, which will further increase balance sheet pressure. If combined with greater volume downturns, the repercussions could be significant.
Our nation’s hospitals continue to rise above the many challenges they face to care for the communities they serve. We will continue to monitor and report on the health of the industry as these critical institutions move forward amid a climate of uncertainty.
Note: The Kaufman Hall Hospital Operating Margin and Operating EBITDA Margin Indices are comprised of the national median of our dataset adjusted for allocations to hospitals from corporate, physician, and other entities.