Key Observations
February was another challenging month for U.S. hospitals and health systems, as margins were affected by continued low outpatient volumes combined with declining inpatient volumes following January’s record-high COVID-19 hospitalizations. As COVID-19 metrics begin to wane and much of the country turns to talk of a possible forthcoming end to the pandemic, hospitals and health systems remain in a tenuous position. Organizations continue to bear the high costs of fighting the unpredictable virus as many non-COVID patients remain reluctant to seek outpatient services. As a result, February expenses rose while margins, volumes, and total revenues all fell below levels seen in February 2020—the last month before the start of the pandemic disrupted everything.
COVID-19 metrics showed promising signs with hospitalizations falling 64% by month’s end from an all-time peak of 132,474 on January 6, according to The COVID Tracking Project, which completed its final analyses in early March. COVID-19 hospitalizations were down to 47,352 on February 28. While still high, it is the lowest they have been since late October 2020. New daily admissions of infected patients dropped 74% from a high of 18,009 on January 5 to 4,772 on February 28, Centers for Disease Control and Prevention (CDC) statistics show. Meanwhile, the number of new cases continued to decline in February as daily vaccinations surged. More than 39 million Americans were fully vaccinated as of March 16.
February hospital margins remained slim to negative. Not including federal CARES funding, the median Kaufman Hall hospital Operating Margin Index* was –0.5%. With the funding, it was 0.4%. The median Operating EBITDA Margin was 4.1% without CARES and 5.4% with CARES.
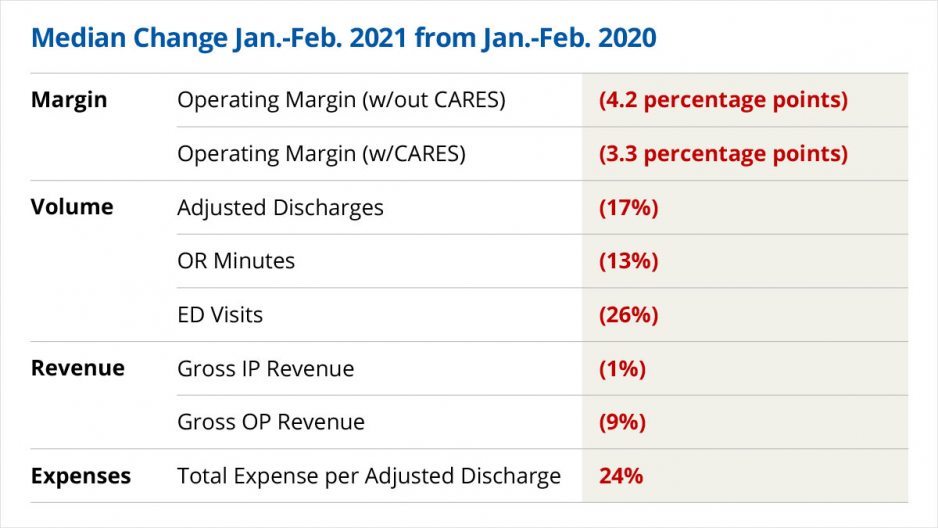
Operating Margin fell 30.8% (3 percentage points) from February 2020 to February 2021 without the federal aid, while Operating EBITDA Margin was down 22.6% (3.2 percentage points). With CARES, Operating Margin fell 23.4% (2.6 percentage points) and Operating EBITDA Margin fell 18.3% (2.4 percentage points) year-over-year (YOY). Looking at year-to-date (YTD) results, Operating Margin declined 48.0% (4.2 percentage points) without CARES and 36.0% (3.3 percentage points) with CARES.
Volumes remained down across most metrics, largely due to decreasing COVID-19 hospitalizations and other consumers delaying or avoiding care for fear of infection. Adjusted Discharges fell 16.8% YTD and 13.8% YOY, Adjusted Patient Days declined 8.8% YTD and 8.3% YOY, and Operating Room Minutes fell 13.0% YTD and 6.9% YOY.
Emergency Department (ED) Visits—which have seen double-digit declines every month since the start of the pandemic—continued to see the largest volume declines, down 25.6% YTD and 26.8% YOY in February. Meanwhile, Average Length of Stay was up 8.5% YTD and 7.3% YOY, but declined 3.4% compared to January, reflecting a decline in high acuity COVID-19 patients requiring longer hospital stays.
February revenue results varied, with declines in overall revenues but increases in adjusted revenues. Gross Operating Revenue (not including CARES) dropped 5.2% YTD and 4.6% YOY. Continued declines in outpatient visits drove Outpatient Revenue down 8.8% YTD and 5.5% YOY, falling below prior-year levels for the tenth time in 11 months. Inpatient Revenue was down 1.3% YTD and 4.4% YOY. After adjusting for the month’s low volumes, Net Patient Service Revenue (NPSR) per Adjusted Discharge rose 16.9% YTD and 14.9% YOY, and NPSR per Adjusted Patient Day rose 7.1% YTD and 7.6% YOY.
Total expenses showed relatively low increases overall, but jumped significantly once adjusted for volume levels. Total Expense was up 2.6% YTD and just 1.1% YOY. Total Labor Expense rose 3.9% YTD and 1.0% YOY, and Total Non-Labor Expense increased 1.2% YTD and 2.2% YOY. Total Expense per Adjusted Discharge, however, was up 24.4% YTD and 19.6% YOY. Labor Expense per Adjusted Discharge increased 25.4% YTD and 18.8% YOY as hospitals maintained elevated staffing levels. Non-Labor Expense per Adjusted Discharge rose 22.1% YTD and 20.7% YOY, driven in part by a 29.1% YOY increase in Drug Expense per Adjusted Discharge and a 24.3% YOY increase in Purchased Service Expense per Adjusted Discharge.
In the broader economy, concerns around increasing bond yields and rising inflation led to a brief sell-off of U.S. Equities during the last two weeks of February, but stocks have since recovered. The unemployment rate remained nearly unchanged at 6.2%, but non-farm payrolls beat expectations, rising 379,000. Fed Chairman Jerome Powell reiterated that the economy is far from achieving the dual mandate of price stability and maximum employment. He said current accommodative monetary policy will remain as appropriate, and indicated he does not view potential acceleration of price increases over the coming months as a long-term inflation threat.
Despite recent, encouraging declines in COVID-19 cases and hospitalizations, February’s performance metrics from hospitals and health systems nationwide illustrate the ongoing uncertainty stemming from a devastating pandemic. Upcoming issues of the National Hospital Flash Report may show gains as the year-over-year figures shift from comparisons to pre-pandemic data to comparisons to March 2020 results and beyond, but those gains will need to be considered in an appropriate context. In the coming months, hospitals and health systems face the challenges of managing declining inpatient volumes as consumer reluctance continues to stress outpatient volumes, and a shift from acute to less acute patients. The pace of these dynamics will vary over time, impacting volumes, revenues, and expenses.
As many push for a rapid return to “normal,” hospital and health system leaders face a hard reality that there may never be a return to the old normal. The pandemic likely will have long-lasting repercussions on patient behavior, volumes, and the role of telehealth in an evolving healthcare landscape.