Search Sort by Newest to OldestOldest to NewestRelevanceA-ZZ-A Pagination First page First Previous page ‹ … Page 5 Current page 6 Page 7 Next page › Last page Last Disruption in the ESI market This week’s graphic dives into how individual coverage health reimbursement arrangements (ICHRAs), a relatively new coverage option, are being received in the market. Infographic A Closer Look at Provider Subsides This week’s graphic dives into a growing challenge facing health systems’ physician enterprises. Infographic Another Year of Increasing ESI Costs As open enrollment approaches for those with employer-sponsored insurance (ESI), this week’s graphic dives into some of the challenges facing the ESI market. Infographic Health Policy in a Non-Healthcare-Centric Election With Election Day less than six weeks away, this week’s graphic compares the positions of Vice President Harris and former President Trump on three of this cycle’s most important healthcare policy issues: competition, Medicare, and the cost of coverage. Infographic Median health system size by the numbers This week’s graphic uses health system size and performance data from the Agency for Healthcare Research and Quality to illustrate what it means to be an average health system. Infographic The state of health system nursing talent retention This week’s graphic highlights data from NSI Nursing Solutions, Inc., and details the current state of hospital turnover and nursing talent retention. Infographic A Historical View of Hospital Operating Margins In this week’s graphic, we highlight nearly 30 years of historical data from Kaufman Hall and the American Hospital Association to provide a broader perspective on hospital operating margins. Infographic The State of American Medical Debt Amid increased bipartisan interest from policymakers on the nation’s increasing medical debt burden (estimated to total at least $220B), this week’s graphic examines who holds medical debt and how recent changes to credit reporting have affected them. Infographic The Evolution of GLP-1 Drug Usage In this week’s graphic, we take stock of both the evolving usage and employer coverage of GLP-1 drugs, specifically for weight loss. Infographic Emergency Departments Leading the Volumes Rebound in 2024 In this week’s graphic, we highlight the most recent data from software and analytics firm Strata Decision Technology to assess how hospital volumes have changed since 2022. Infographic Outpatient Shift Turning to New Specialties Using the latest data forecast from Sg2, a Vizient company, the graphic below illustrates how the outpatient shift will continue to accelerate through 2034. Infographic A Closer Look at Nursing Facility Readiness for New Staffing Minimums In late April, the Centers for Medicare & Medicaid Services (CMS) established new staffing standards for long-term care (LTC) facilities, mandating a minimum of 3.48 hours of nursing care per patient per day, with 33 minutes of that care from a registered nurse, at least one of whom must be always on site. Infographic Pagination First page First Previous page ‹ … Page 5 Current page 6 Page 7 Next page › Last page Last
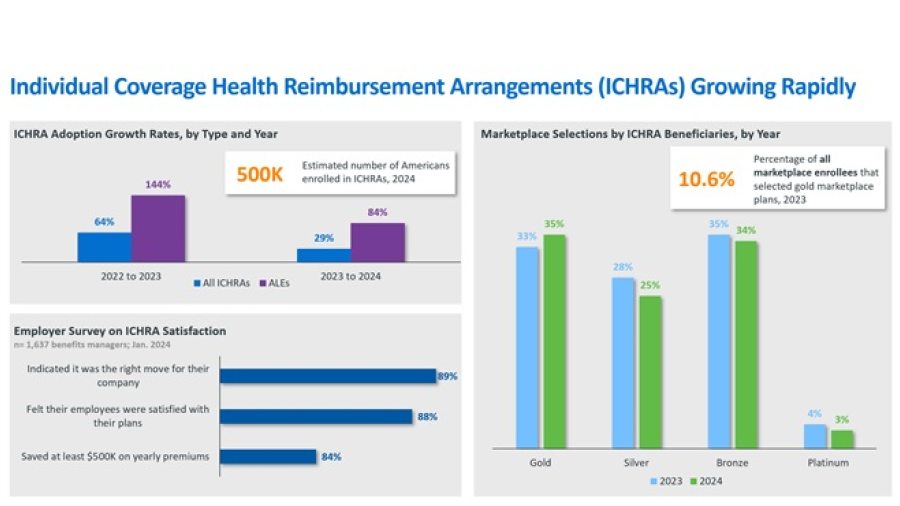
Disruption in the ESI market This week’s graphic dives into how individual coverage health reimbursement arrangements (ICHRAs), a relatively new coverage option, are being received in the market. Infographic
A Closer Look at Provider Subsides This week’s graphic dives into a growing challenge facing health systems’ physician enterprises. Infographic
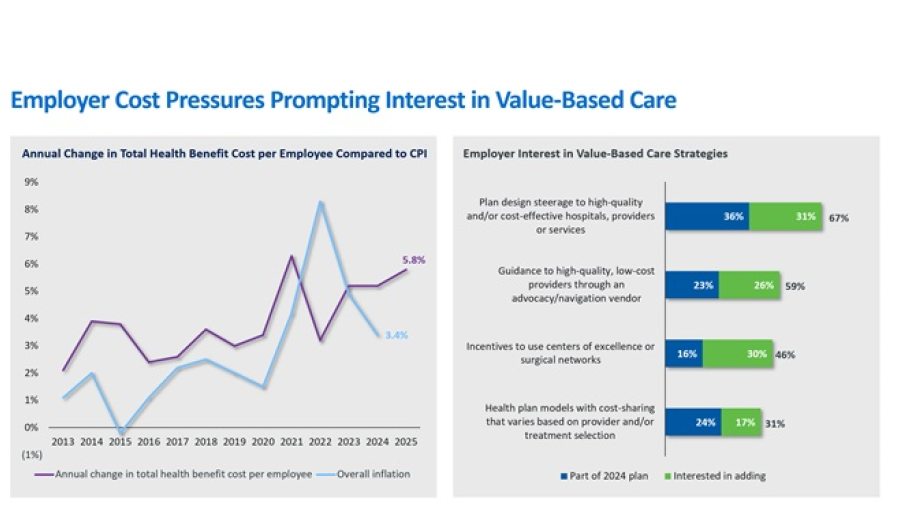
Another Year of Increasing ESI Costs As open enrollment approaches for those with employer-sponsored insurance (ESI), this week’s graphic dives into some of the challenges facing the ESI market. Infographic
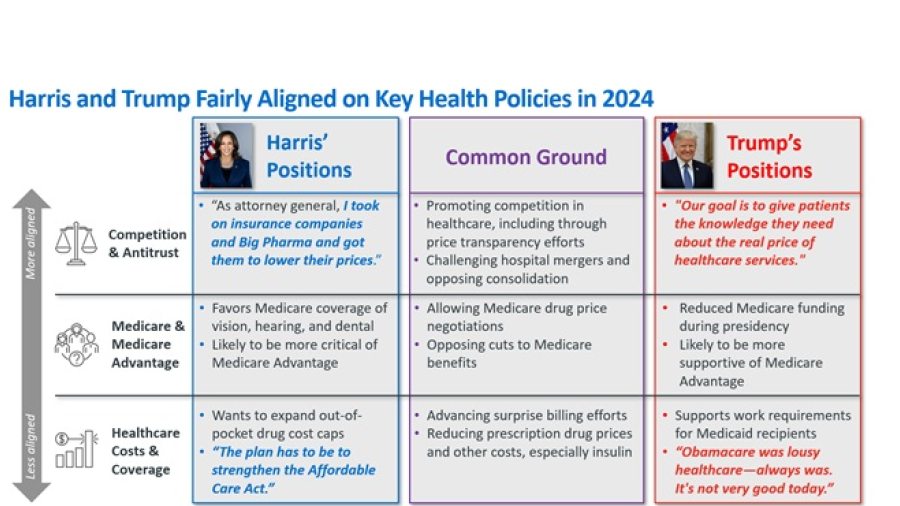
Health Policy in a Non-Healthcare-Centric Election With Election Day less than six weeks away, this week’s graphic compares the positions of Vice President Harris and former President Trump on three of this cycle’s most important healthcare policy issues: competition, Medicare, and the cost of coverage. Infographic
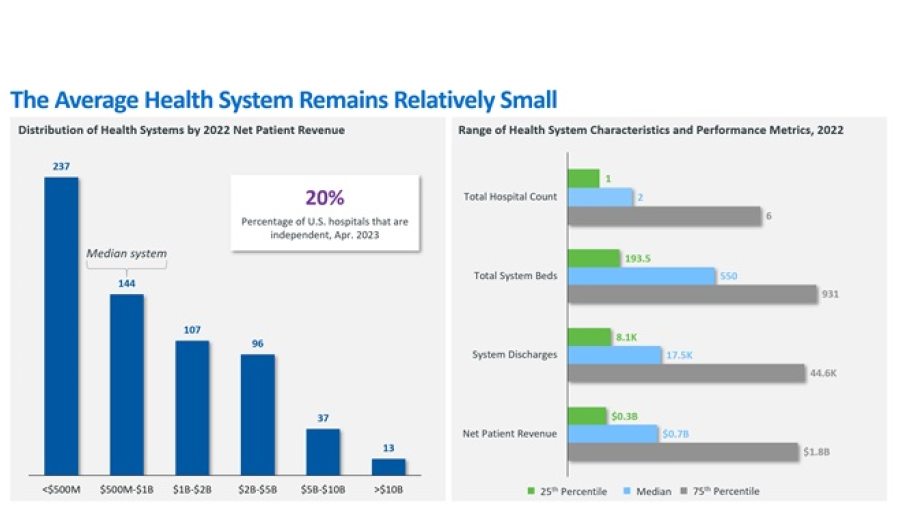
Median health system size by the numbers This week’s graphic uses health system size and performance data from the Agency for Healthcare Research and Quality to illustrate what it means to be an average health system. Infographic
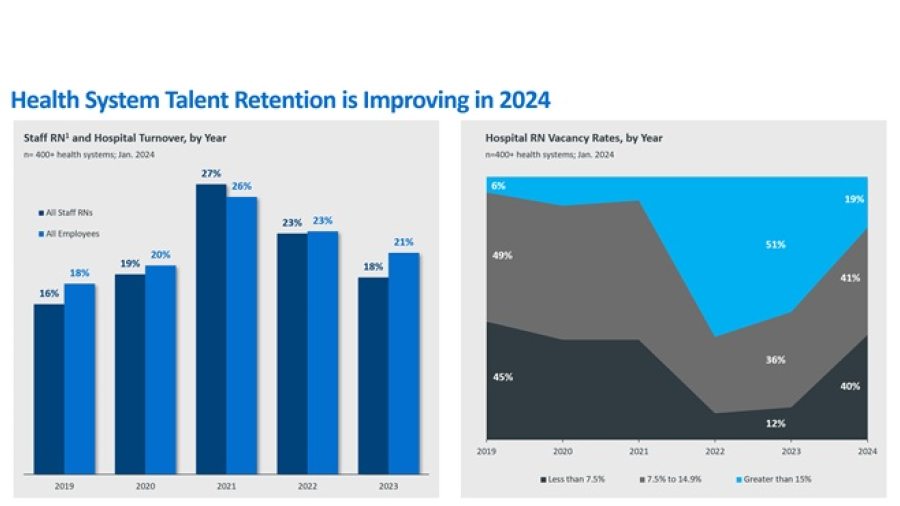
The state of health system nursing talent retention This week’s graphic highlights data from NSI Nursing Solutions, Inc., and details the current state of hospital turnover and nursing talent retention. Infographic
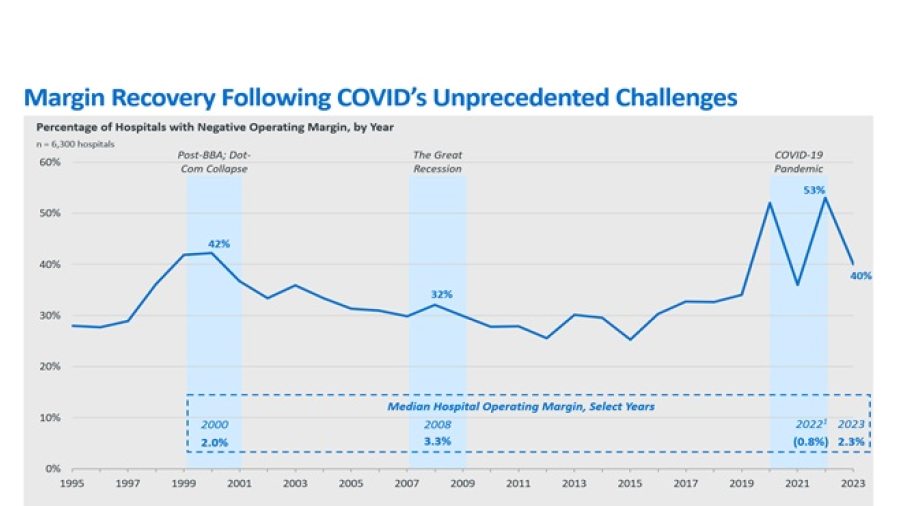
A Historical View of Hospital Operating Margins In this week’s graphic, we highlight nearly 30 years of historical data from Kaufman Hall and the American Hospital Association to provide a broader perspective on hospital operating margins. Infographic
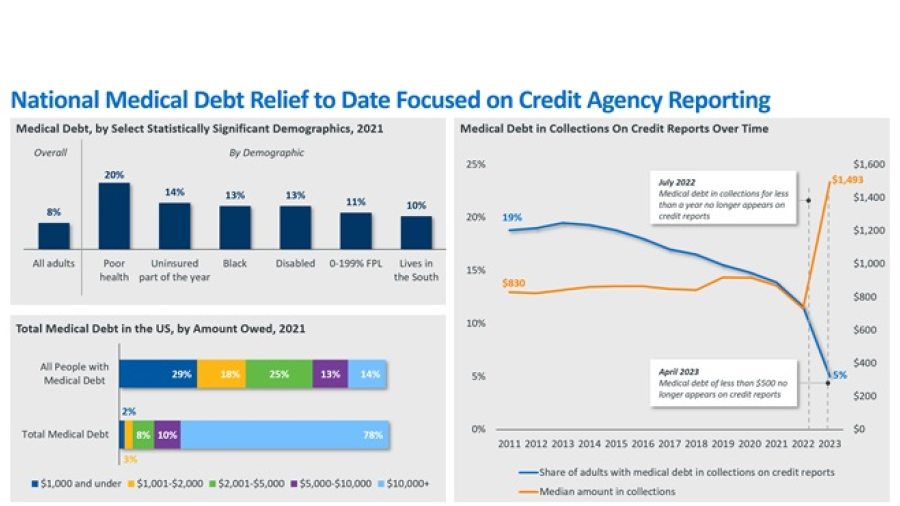
The State of American Medical Debt Amid increased bipartisan interest from policymakers on the nation’s increasing medical debt burden (estimated to total at least $220B), this week’s graphic examines who holds medical debt and how recent changes to credit reporting have affected them. Infographic
The Evolution of GLP-1 Drug Usage In this week’s graphic, we take stock of both the evolving usage and employer coverage of GLP-1 drugs, specifically for weight loss. Infographic
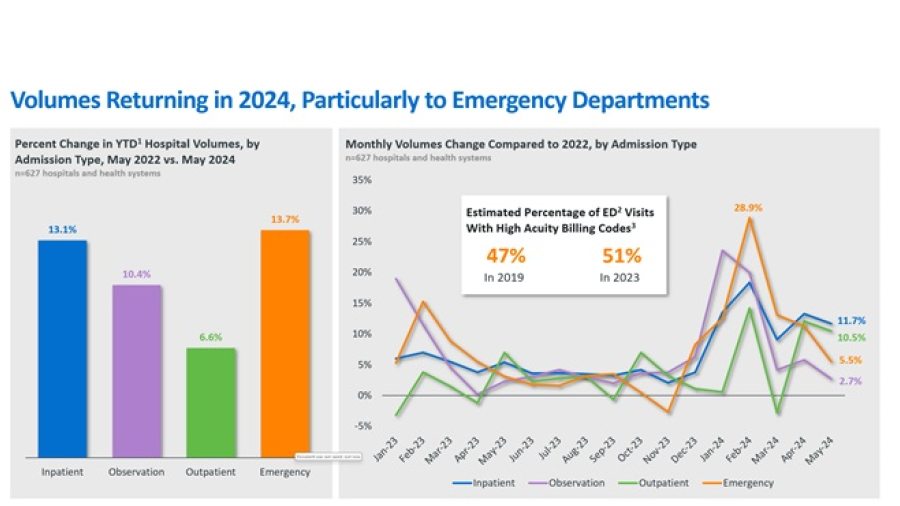
Emergency Departments Leading the Volumes Rebound in 2024 In this week’s graphic, we highlight the most recent data from software and analytics firm Strata Decision Technology to assess how hospital volumes have changed since 2022. Infographic
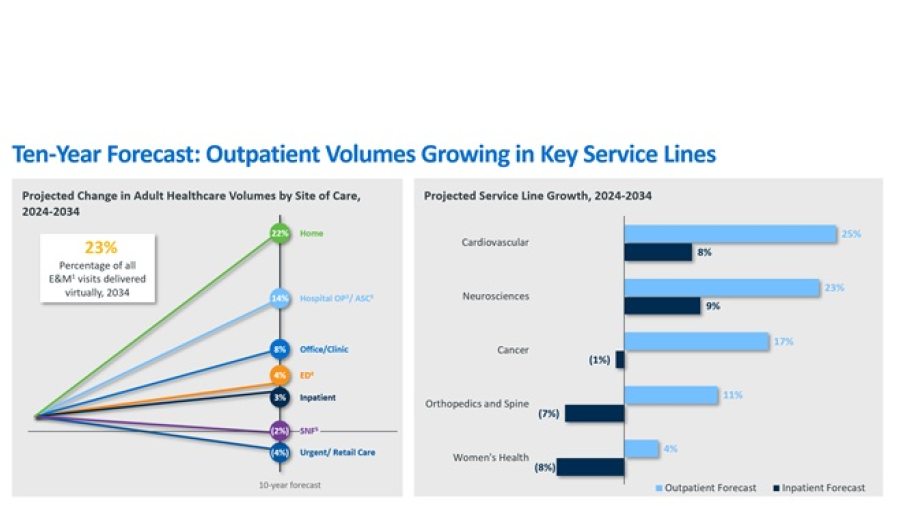
Outpatient Shift Turning to New Specialties Using the latest data forecast from Sg2, a Vizient company, the graphic below illustrates how the outpatient shift will continue to accelerate through 2034. Infographic
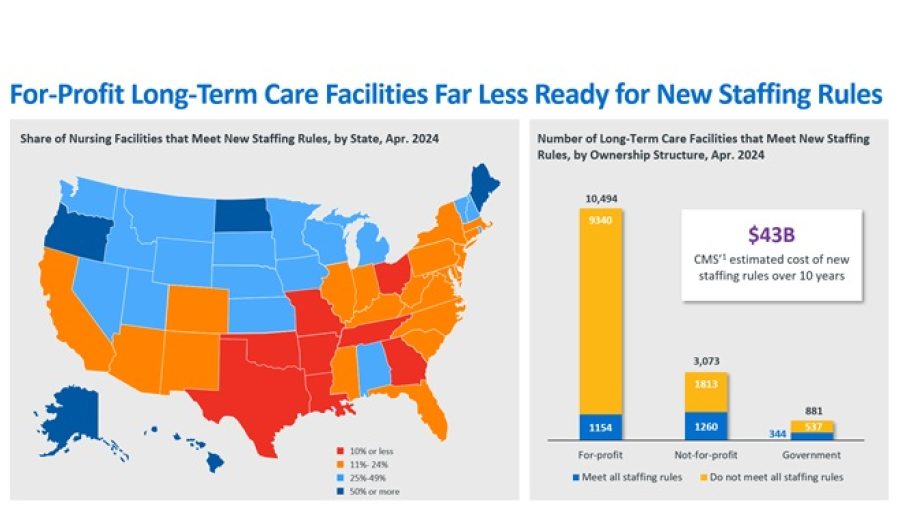
A Closer Look at Nursing Facility Readiness for New Staffing Minimums In late April, the Centers for Medicare & Medicaid Services (CMS) established new staffing standards for long-term care (LTC) facilities, mandating a minimum of 3.48 hours of nursing care per patient per day, with 33 minutes of that care from a registered nurse, at least one of whom must be always on site. Infographic