Search Sort by Newest to OldestOldest to NewestRelevanceA-ZZ-A Pagination First page First Previous page ‹ … Page 4 Current page 5 Page 6 … Next page › Last page Last PSHPs Report Better Preventative Care Outcomes Following last week’s graphic on Medicare Advantage (MA) star ratings, this week we highlight how different types of MA plans perform along certain patient outcomes metrics. Infographic MA Enrollees Continue to Choose Highly Rated Plans With the new year marking the official start of another record-breaking year for Medicare Advantage (MA) enrollment, this week’s graphic takes a look at MA star ratings. Infographic Rating Agencies Upgrade Not-for-Profit Hospital Outlook Congress scrambles for a new funding deal, a report details the financial impacts of a mandatory bundled payment model, and a woman receives a genetically modified pig kidney transplant. Infographic Assessing the Results of Medicaid Unwinding With the onset of the pandemic in March 2020, states were required to provide continuous enrollment for Medicaid and Children’s Health Insurance Program (CHIP) beneficiaries in exchange for enhanced federal funding. Infographic Declining MLRs Only Part of Payers' Profitability Challenges Following the release of Q3 financial reports, this week’s graphic takes stock of large health insurance companies’ recent financial performances. Infographic More States and Hospitals Utilizing State-Directed Payments This week’s graphic highlights the increasing prominence of state-directed payment (SDP) arrangements for Medicaid programs nationwide. Infographic Epic Increases Lead in the EHR Market This week’s graphic illustrates how Epic has continued to expand its lead in the electronic health record (EHR) market over its rival Oracle Health, which acquired Cerner in 2022. Infographic Providers Increasingly Frustrated by Lost Revenues from Medicare Advantage Plans After hearing reports from health systems about decreasing revenue capture from Medicare Advantage (MA) plans, this graphic dives into some of the trends driving this costly challenge providers are facing. Infographic Reassessing retail health disruptors One year after retail health expansion reached a fever pitch, this week’s graphic takes stock of disruptors’ care delivery strategies. Infographic Disruption in the ESI market This week’s graphic dives into how individual coverage health reimbursement arrangements (ICHRAs), a relatively new coverage option, are being received in the market. Infographic A Closer Look at Provider Subsides This week’s graphic dives into a growing challenge facing health systems’ physician enterprises. Infographic Another Year of Increasing ESI Costs As open enrollment approaches for those with employer-sponsored insurance (ESI), this week’s graphic dives into some of the challenges facing the ESI market. Infographic Pagination First page First Previous page ‹ … Page 4 Current page 5 Page 6 … Next page › Last page Last
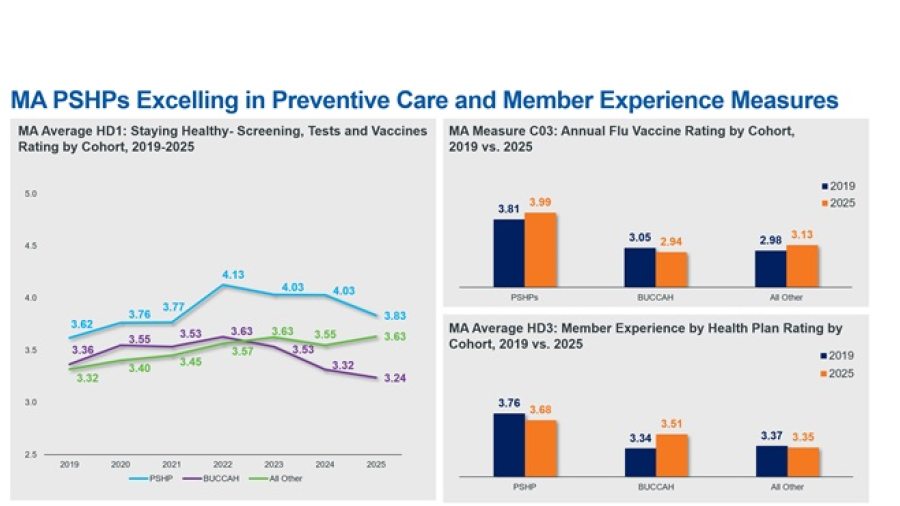
PSHPs Report Better Preventative Care Outcomes Following last week’s graphic on Medicare Advantage (MA) star ratings, this week we highlight how different types of MA plans perform along certain patient outcomes metrics. Infographic
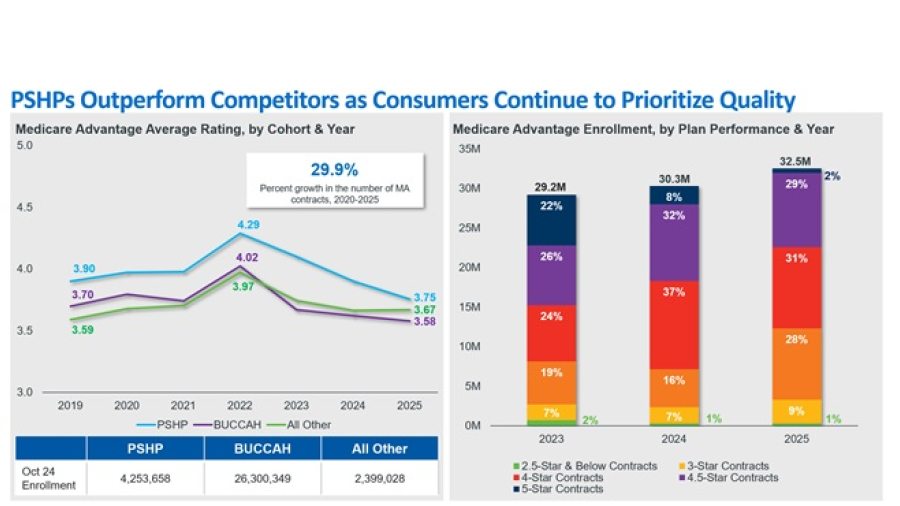
MA Enrollees Continue to Choose Highly Rated Plans With the new year marking the official start of another record-breaking year for Medicare Advantage (MA) enrollment, this week’s graphic takes a look at MA star ratings. Infographic
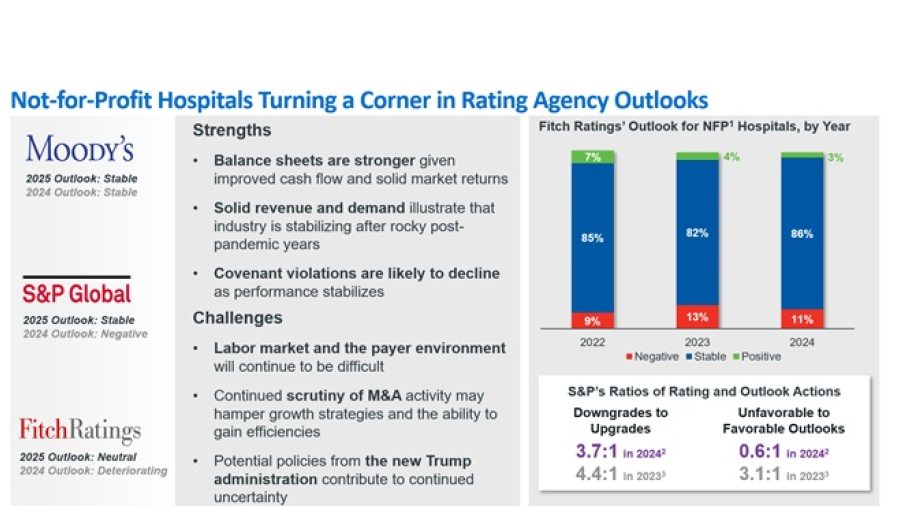
Rating Agencies Upgrade Not-for-Profit Hospital Outlook Congress scrambles for a new funding deal, a report details the financial impacts of a mandatory bundled payment model, and a woman receives a genetically modified pig kidney transplant. Infographic
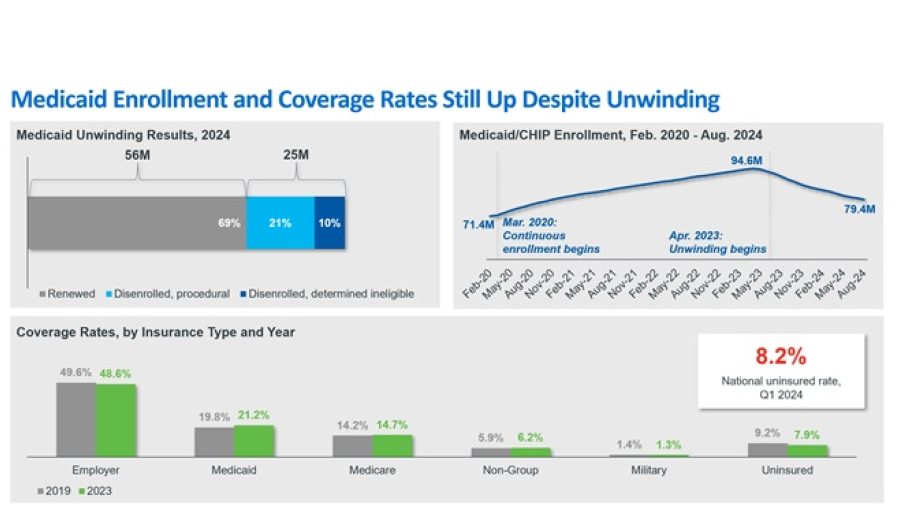
Assessing the Results of Medicaid Unwinding With the onset of the pandemic in March 2020, states were required to provide continuous enrollment for Medicaid and Children’s Health Insurance Program (CHIP) beneficiaries in exchange for enhanced federal funding. Infographic
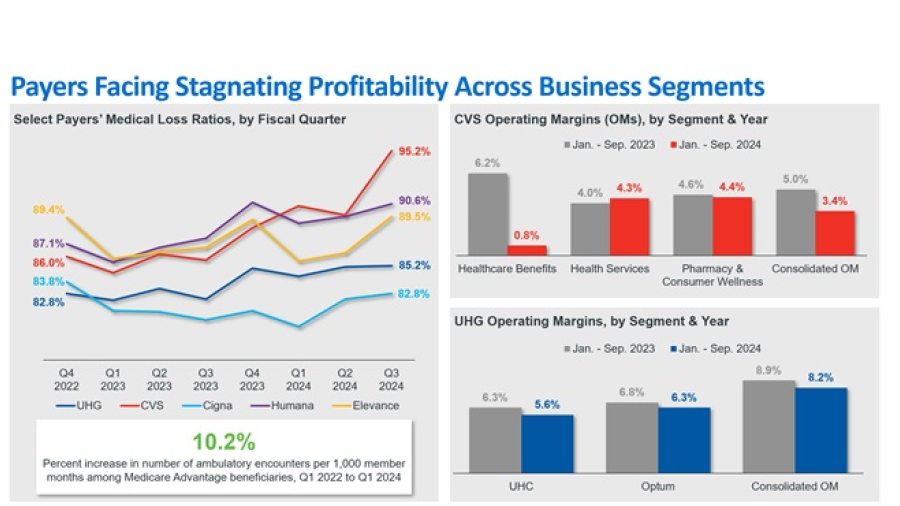
Declining MLRs Only Part of Payers' Profitability Challenges Following the release of Q3 financial reports, this week’s graphic takes stock of large health insurance companies’ recent financial performances. Infographic
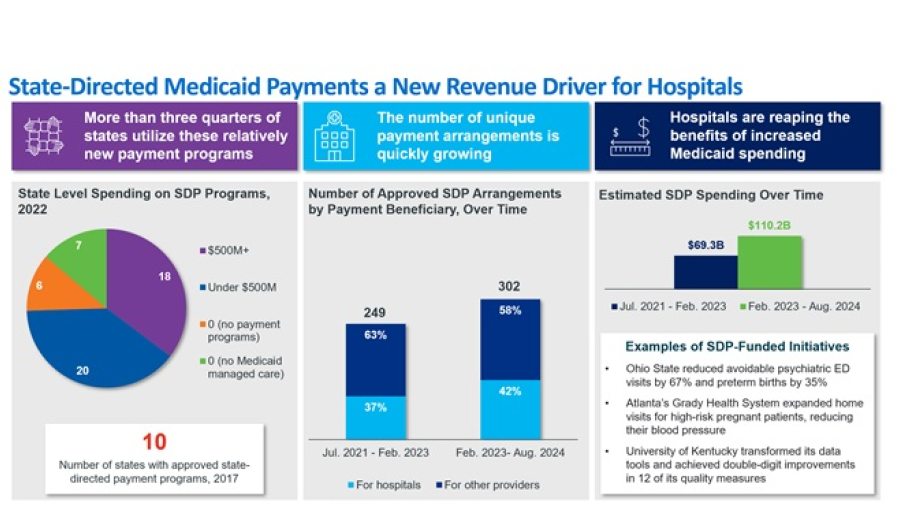
More States and Hospitals Utilizing State-Directed Payments This week’s graphic highlights the increasing prominence of state-directed payment (SDP) arrangements for Medicaid programs nationwide. Infographic
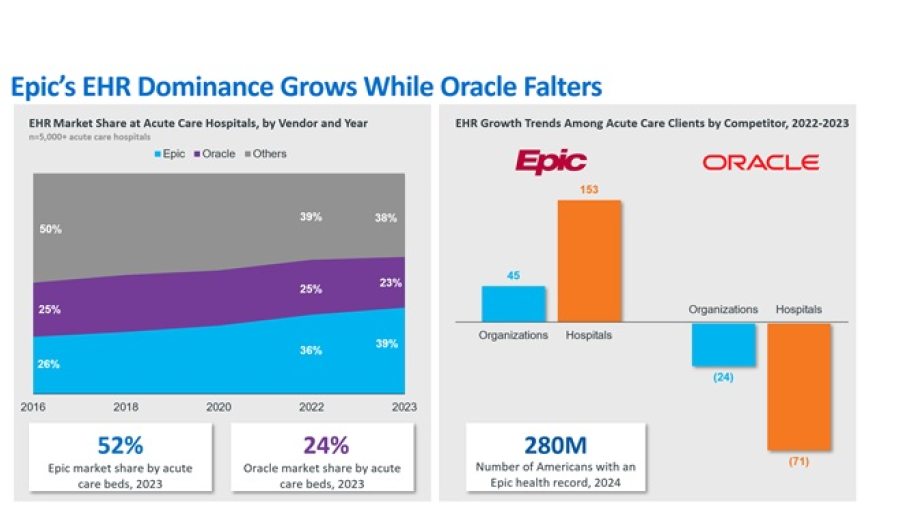
Epic Increases Lead in the EHR Market This week’s graphic illustrates how Epic has continued to expand its lead in the electronic health record (EHR) market over its rival Oracle Health, which acquired Cerner in 2022. Infographic
Providers Increasingly Frustrated by Lost Revenues from Medicare Advantage Plans After hearing reports from health systems about decreasing revenue capture from Medicare Advantage (MA) plans, this graphic dives into some of the trends driving this costly challenge providers are facing. Infographic
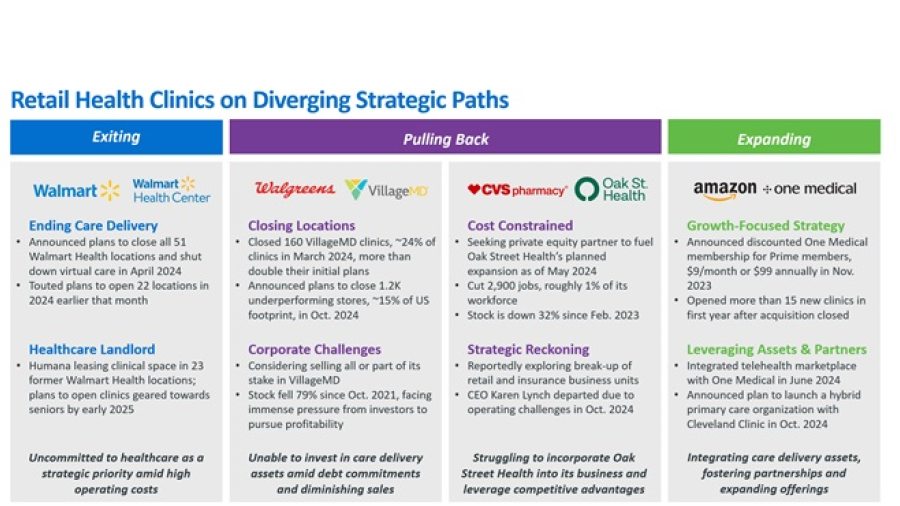
Reassessing retail health disruptors One year after retail health expansion reached a fever pitch, this week’s graphic takes stock of disruptors’ care delivery strategies. Infographic
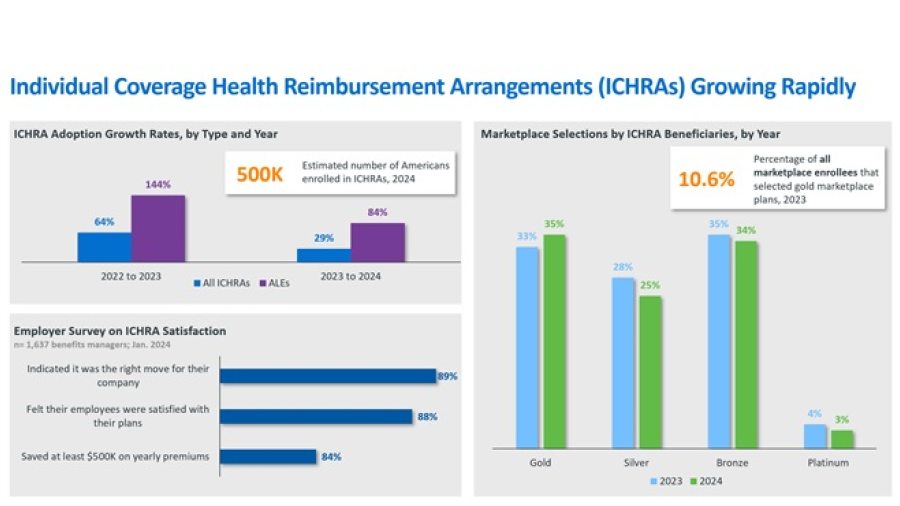
Disruption in the ESI market This week’s graphic dives into how individual coverage health reimbursement arrangements (ICHRAs), a relatively new coverage option, are being received in the market. Infographic
A Closer Look at Provider Subsides This week’s graphic dives into a growing challenge facing health systems’ physician enterprises. Infographic
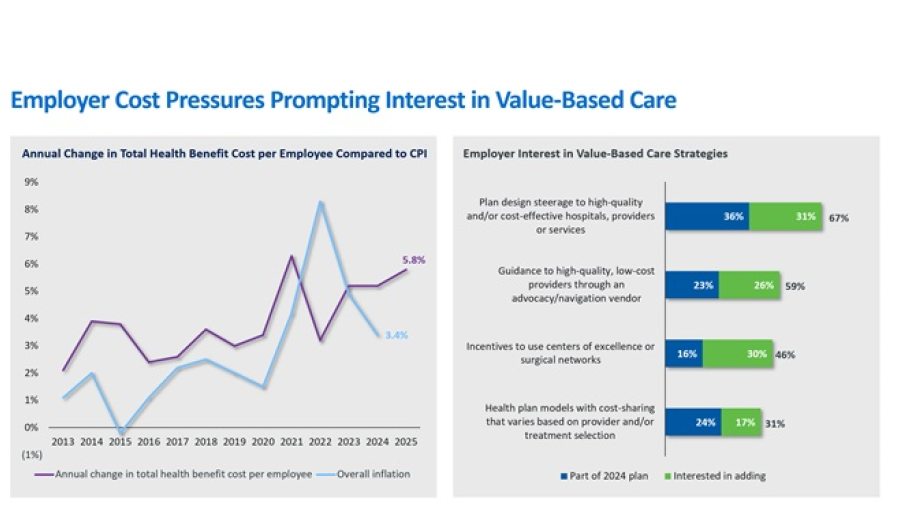
Another Year of Increasing ESI Costs As open enrollment approaches for those with employer-sponsored insurance (ESI), this week’s graphic dives into some of the challenges facing the ESI market. Infographic