Search Sort by Newest to OldestOldest to NewestRelevanceA-ZZ-A Pagination First page First Previous page ‹ … Page 3 Current page 4 Page 5 … Next page › Last page Last Cancer diagnoses among younger generations increasing This week’s graphic highlights data from a recent study published by The Lancet on cancer incidence trends in the United States between 2000 and 2019 among those born between 1920 and 1990. Of the 34 types of cancer studied, 17 were found to have an increased incidence among those from the Generation X and Millennial cohorts Infographic Health system talent retention in 2025 This week’s graphic, highlighting data from NSI Nursing Solutions, Inc., details the current state of hospital turnover and nursing talent retention. Infographic Implications of potential federal policy changes for hospitals In this week’s graphic, we highlight new analysis from our colleagues at Sg2 that illustrates a framework to help providers evaluate the implications of a changing policy landscape. Infographic Senior Living M&A Acquisitions Increase Again in 2024 This week’s graphic highlights new data that illustrates interesting trends in senior living mergers and acquisitions. An increasingly common trend for hospitals consolidation is also continuing in the senior living market. Infographic Healthcare Companies Report 2024 Financials In this week’s graphic, we highlight 2024 financial data from some of the healthcare industry’s most prominent companies and largest provider organizations. Infographic Providing Health Insurance was Less Lucrative in 2024 This week’s graphic takes stock of the 2024 financial performance of four leading insurers: Humana, Cigna, CVS and UHG. Infographic The State of Hospital Volumes The graphic highlights the most recent data from software and analytics firm Strata Decision Technology comparing 2024 hospital volumes by admission types with 2023 and 2022 volumes. Infographic The State of Trust in Public Health in America In light of the recent confirmation of Secretary Kennedy to lead HHS and new survey data on trust in public health, this graphic highlights Americans’ declining positive perception of public health officials. Infographic Health Policy in the Second Trump Administration Following President Trump’s busy first few weeks in office, this week’s graphic takes stock of the president’s health policy actions to date. Infographic The State of Hospital Operations in 2024 From a revenue perspective, hospitals’ investments in outpatient care are reaping dividends, and 2024 as an operating year was largely better than 2023. Infographic The State of Rural Healthcare This week’s graphic illustrates the challenging operating environment many rural hospitals find themselves in. Infographic Hospital and Health System M&A Trends in 2024 This week’s graphic highlights data from Kaufman Hall’s recently released 2024 Hospital and Health System M&A in Review report on the current dynamics in health system merger and acquisition (M&A) activity. Infographic Pagination First page First Previous page ‹ … Page 3 Current page 4 Page 5 … Next page › Last page Last
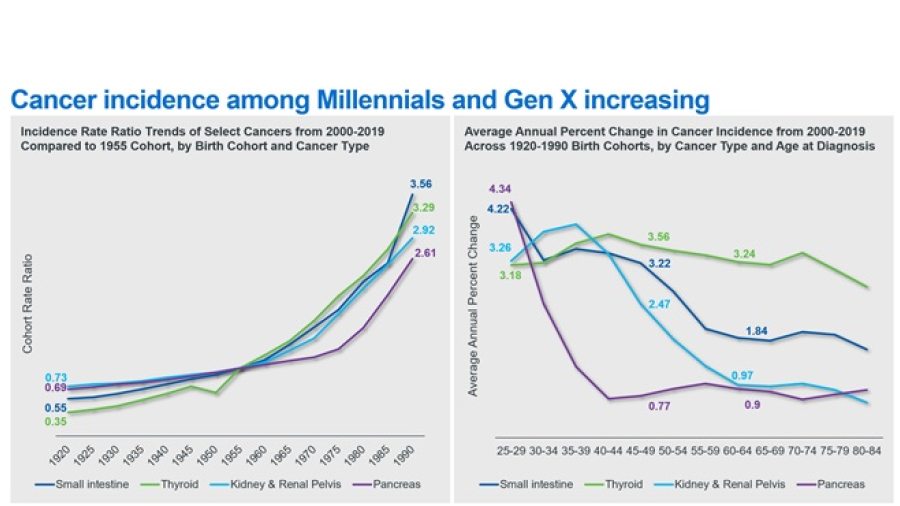
Cancer diagnoses among younger generations increasing This week’s graphic highlights data from a recent study published by The Lancet on cancer incidence trends in the United States between 2000 and 2019 among those born between 1920 and 1990. Of the 34 types of cancer studied, 17 were found to have an increased incidence among those from the Generation X and Millennial cohorts Infographic
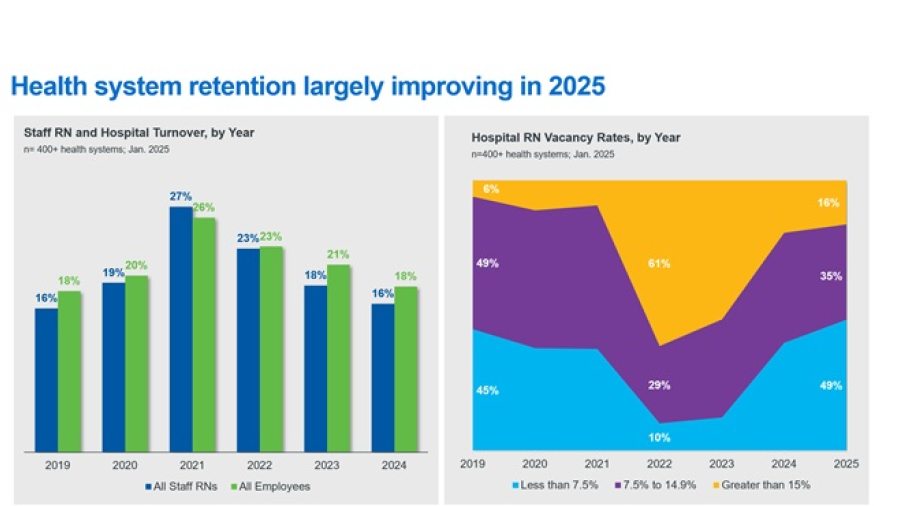
Health system talent retention in 2025 This week’s graphic, highlighting data from NSI Nursing Solutions, Inc., details the current state of hospital turnover and nursing talent retention. Infographic
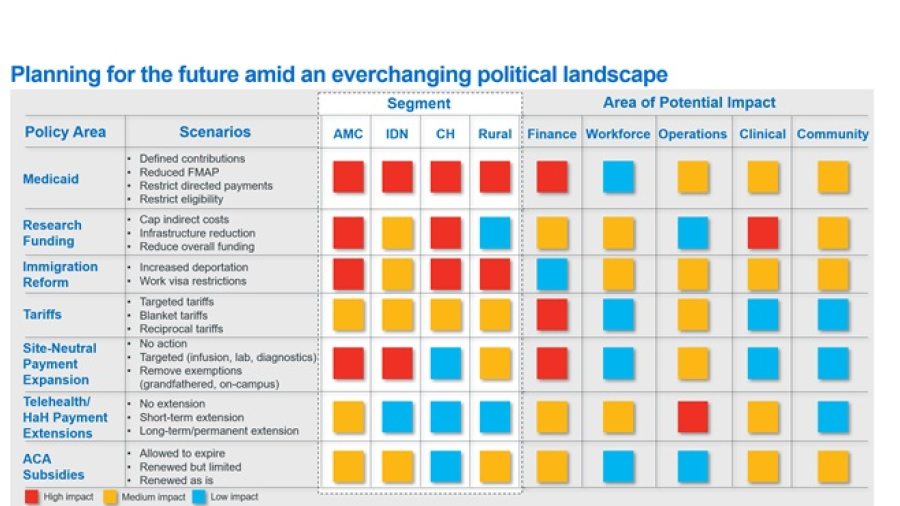
Implications of potential federal policy changes for hospitals In this week’s graphic, we highlight new analysis from our colleagues at Sg2 that illustrates a framework to help providers evaluate the implications of a changing policy landscape. Infographic
Senior Living M&A Acquisitions Increase Again in 2024 This week’s graphic highlights new data that illustrates interesting trends in senior living mergers and acquisitions. An increasingly common trend for hospitals consolidation is also continuing in the senior living market. Infographic
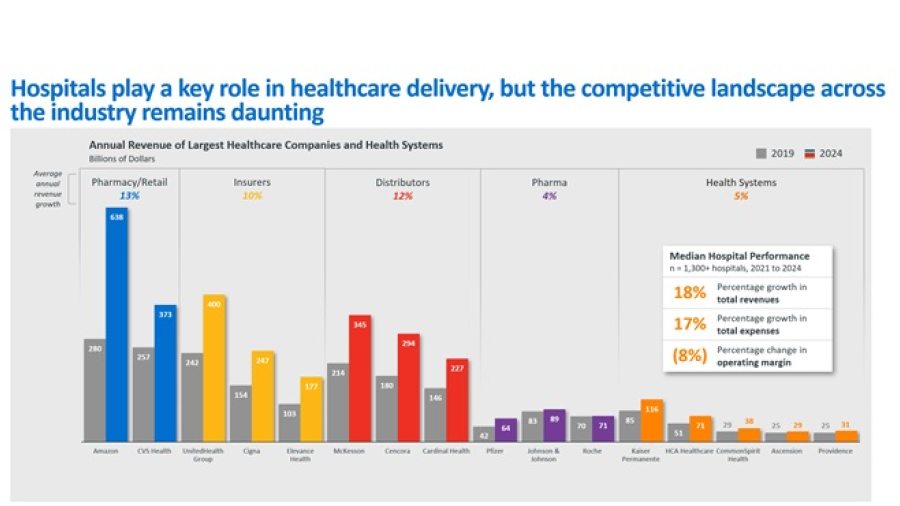
Healthcare Companies Report 2024 Financials In this week’s graphic, we highlight 2024 financial data from some of the healthcare industry’s most prominent companies and largest provider organizations. Infographic
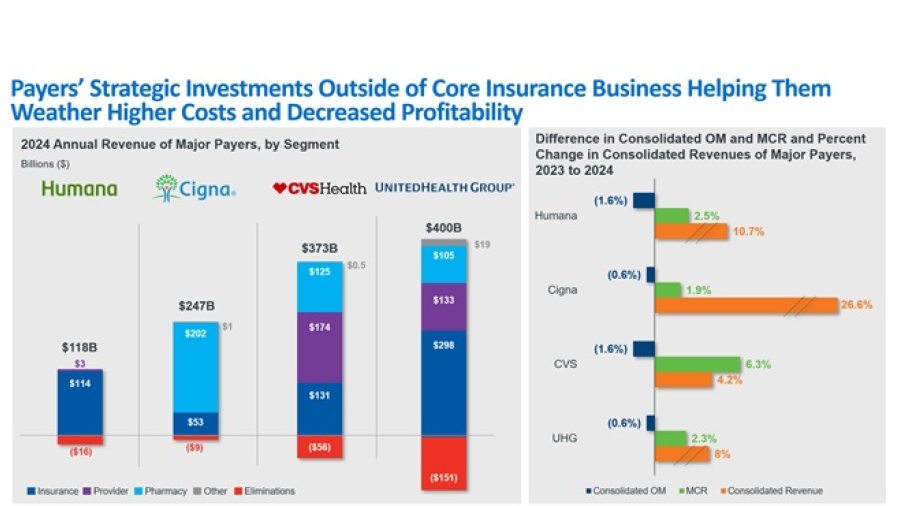
Providing Health Insurance was Less Lucrative in 2024 This week’s graphic takes stock of the 2024 financial performance of four leading insurers: Humana, Cigna, CVS and UHG. Infographic
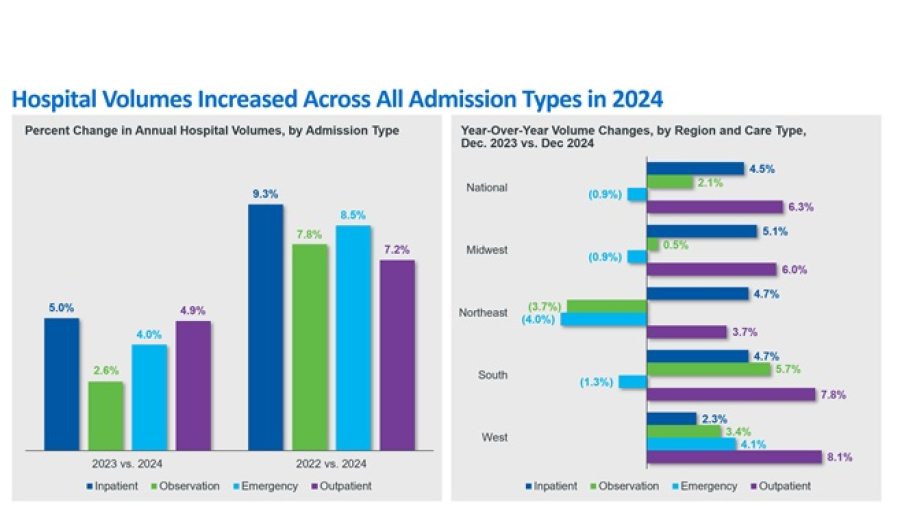
The State of Hospital Volumes The graphic highlights the most recent data from software and analytics firm Strata Decision Technology comparing 2024 hospital volumes by admission types with 2023 and 2022 volumes. Infographic
The State of Trust in Public Health in America In light of the recent confirmation of Secretary Kennedy to lead HHS and new survey data on trust in public health, this graphic highlights Americans’ declining positive perception of public health officials. Infographic
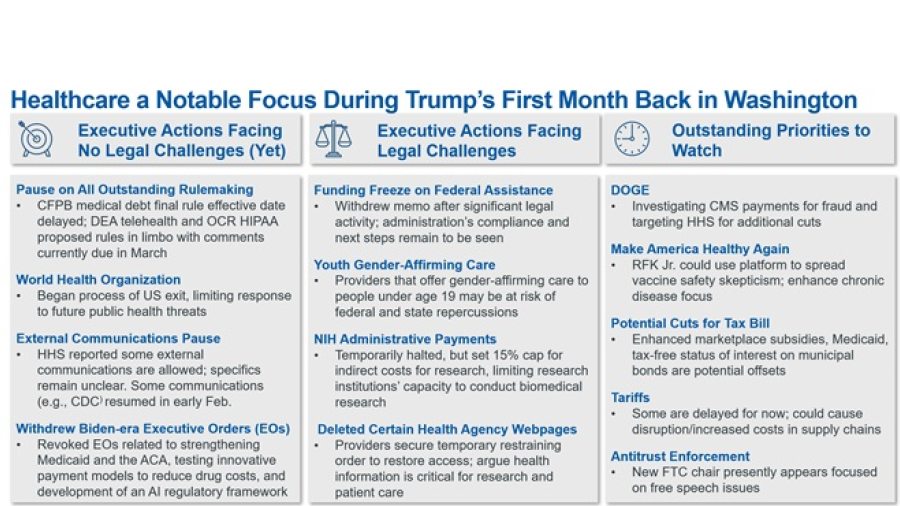
Health Policy in the Second Trump Administration Following President Trump’s busy first few weeks in office, this week’s graphic takes stock of the president’s health policy actions to date. Infographic
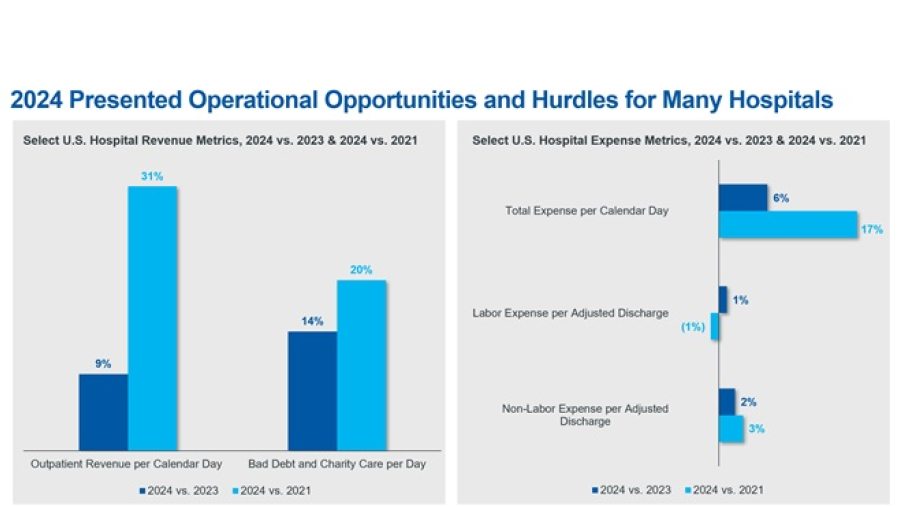
The State of Hospital Operations in 2024 From a revenue perspective, hospitals’ investments in outpatient care are reaping dividends, and 2024 as an operating year was largely better than 2023. Infographic
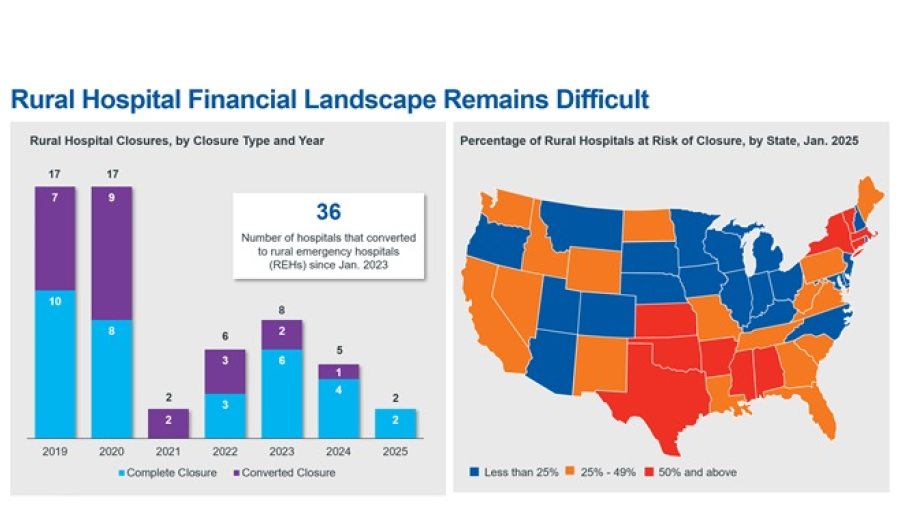
The State of Rural Healthcare This week’s graphic illustrates the challenging operating environment many rural hospitals find themselves in. Infographic
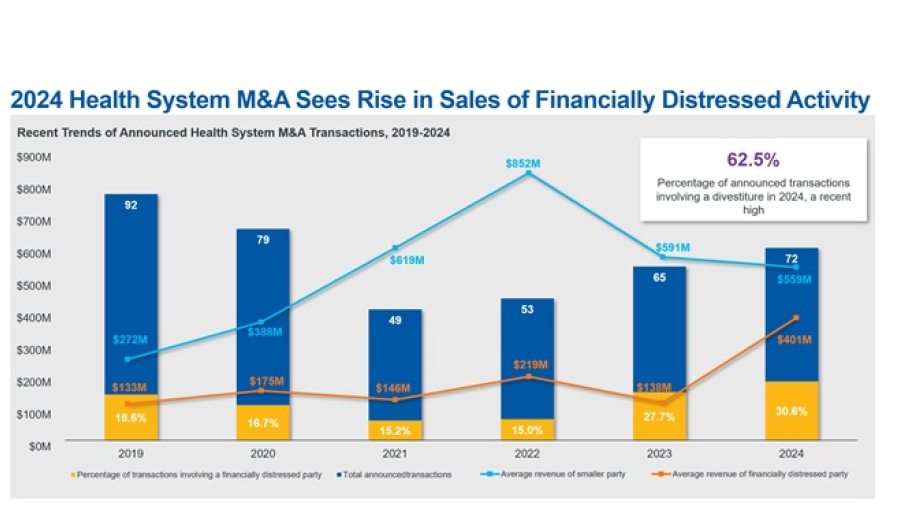
Hospital and Health System M&A Trends in 2024 This week’s graphic highlights data from Kaufman Hall’s recently released 2024 Hospital and Health System M&A in Review report on the current dynamics in health system merger and acquisition (M&A) activity. Infographic