Search Sort by Newest to OldestOldest to NewestRelevanceA-ZZ-A Pagination Current page 1 Page 2 Page 3 … Next page › Last page Last Most U.S. adults want extension of ACA tax credits As Congress debates extending the enhanced advanced premium tax credits as part of broader spending bill negotiations, a new KFF poll shows overwhelming bipartisan support for keeping... Infographic A deep dive into state health scorecards This week’s graphic highlights a new report from The Commonwealth Fund with data on state-by-state health performance. Infographic Medicaid a prominent coverage provider among birthing parents In light of Medicaid cuts in the now-signed OBBB becoming law, this week’s graphic highlights a prominent use of Medicaid. Infographic Demographics behind youth firearm ED visits Demographics behind youth firearm ED visits Infographic Intersection of performance improvement and health access This week’s graphic highlights Vizient Vulnerability Index (VVI) and procedure utilization data to show how utilization differs when certain socioeconomic factors are considered. Infographic Epic increases lead in electronic health record market This week’s graphic illustrates how Epic has continued to expand its lead in the electronic health record (EHR) market over its rival Oracle Health, which acquired Cerner in 2022. Infographic Healthcare affordability declining This week’s graphic highlights new Gallup survey data and Bureau of Labor Statistics inflation data to consider growing healthcare affordability challenges. Infographic Addressing climate change a prominent goal for clinicians In honor of Earth Day this Tuesday, this week’s graphic demonstrates the importance for hospitals to address climate change. Infographic Cancer diagnoses among younger generations increasing This week’s graphic highlights data from a recent study published by The Lancet on cancer incidence trends in the United States between 2000 and 2019 among those born between 1920 and 1990. Of the 34 types of cancer studied, 17 were found to have an increased incidence among those from the Generation X and Millennial cohorts Infographic Implications of potential federal policy changes for hospitals In this week’s graphic, we highlight new analysis from our colleagues at Sg2 that illustrates a framework to help providers evaluate the implications of a changing policy landscape. Infographic The State of Hospital Volumes The graphic highlights the most recent data from software and analytics firm Strata Decision Technology comparing 2024 hospital volumes by admission types with 2023 and 2022 volumes. Infographic The State of Trust in Public Health in America In light of the recent confirmation of Secretary Kennedy to lead HHS and new survey data on trust in public health, this graphic highlights Americans’ declining positive perception of public health officials. Infographic Pagination Current page 1 Page 2 Page 3 … Next page › Last page Last
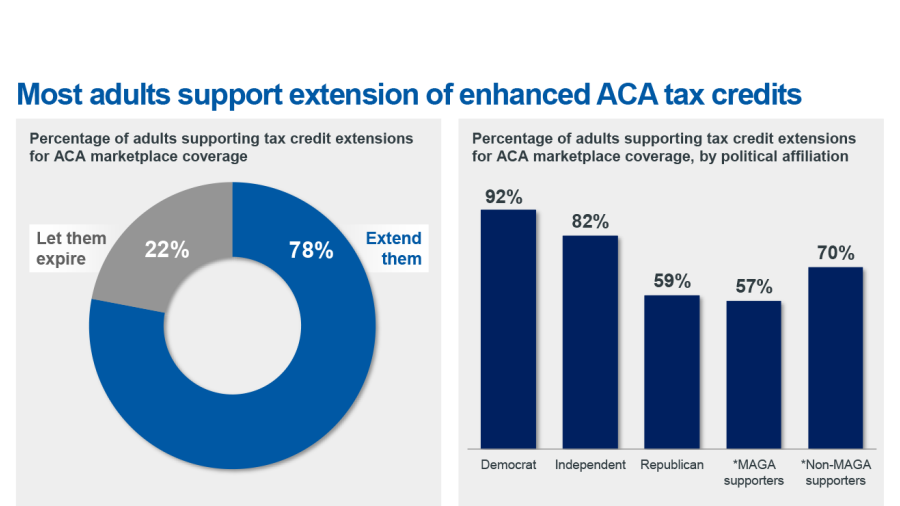
Most U.S. adults want extension of ACA tax credits As Congress debates extending the enhanced advanced premium tax credits as part of broader spending bill negotiations, a new KFF poll shows overwhelming bipartisan support for keeping... Infographic
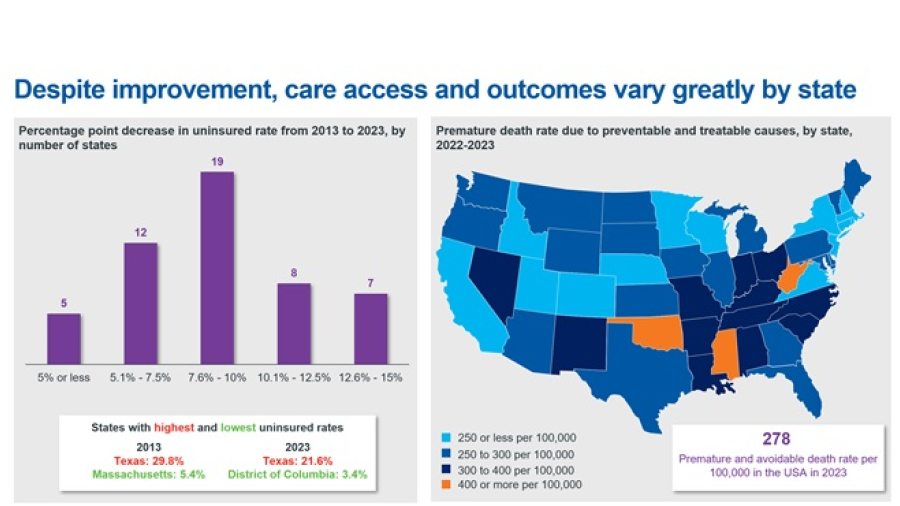
A deep dive into state health scorecards This week’s graphic highlights a new report from The Commonwealth Fund with data on state-by-state health performance. Infographic
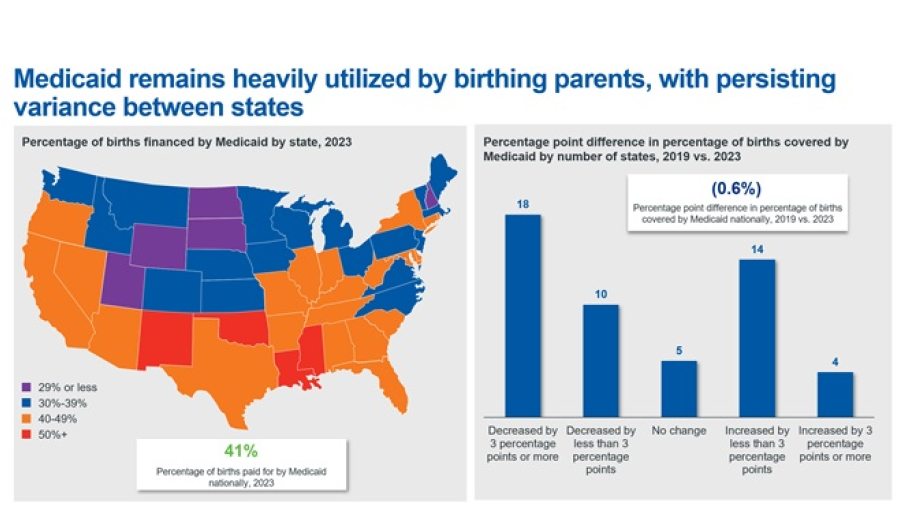
Medicaid a prominent coverage provider among birthing parents In light of Medicaid cuts in the now-signed OBBB becoming law, this week’s graphic highlights a prominent use of Medicaid. Infographic
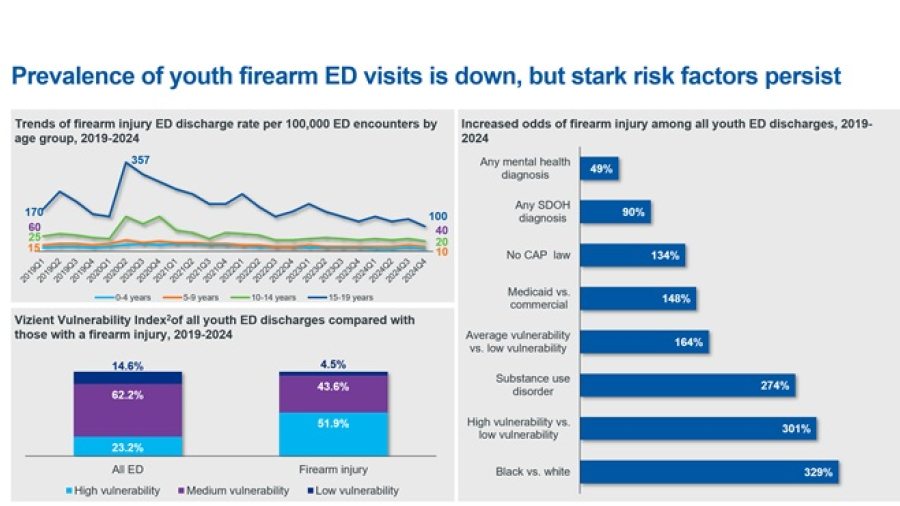
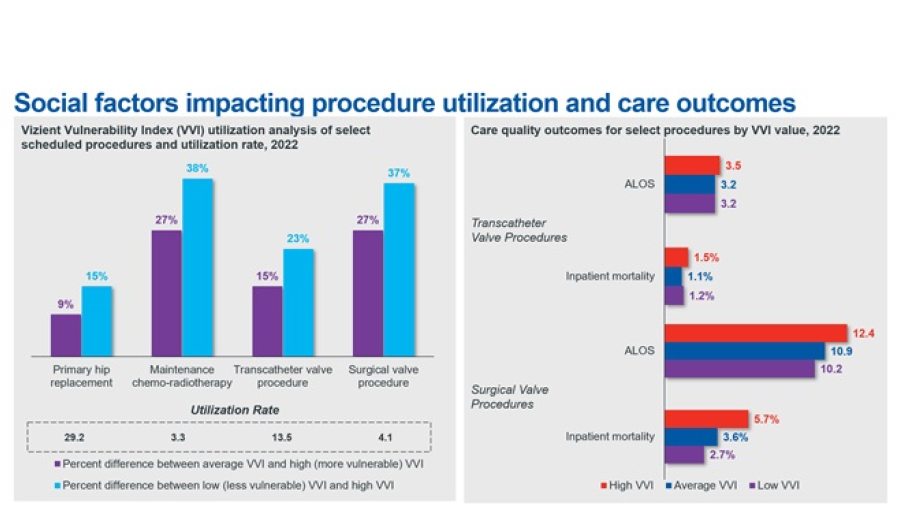
Intersection of performance improvement and health access This week’s graphic highlights Vizient Vulnerability Index (VVI) and procedure utilization data to show how utilization differs when certain socioeconomic factors are considered. Infographic
Epic increases lead in electronic health record market This week’s graphic illustrates how Epic has continued to expand its lead in the electronic health record (EHR) market over its rival Oracle Health, which acquired Cerner in 2022. Infographic
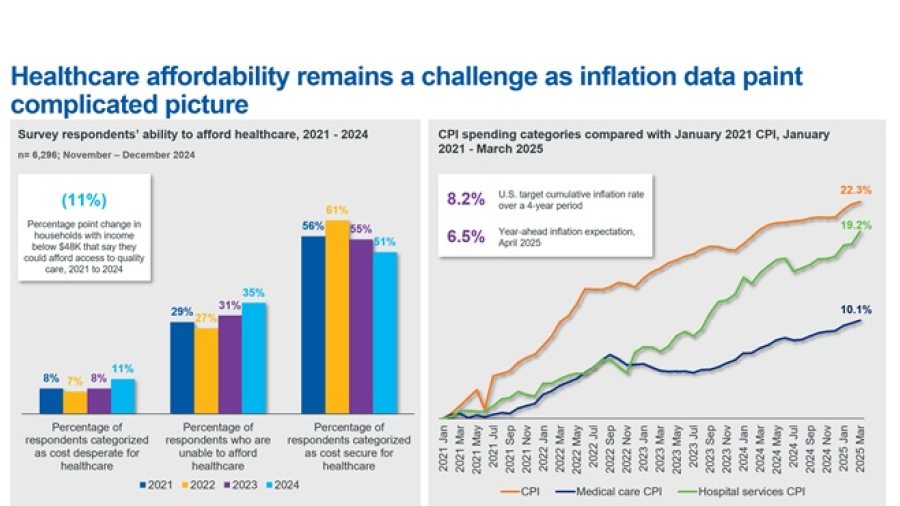
Healthcare affordability declining This week’s graphic highlights new Gallup survey data and Bureau of Labor Statistics inflation data to consider growing healthcare affordability challenges. Infographic
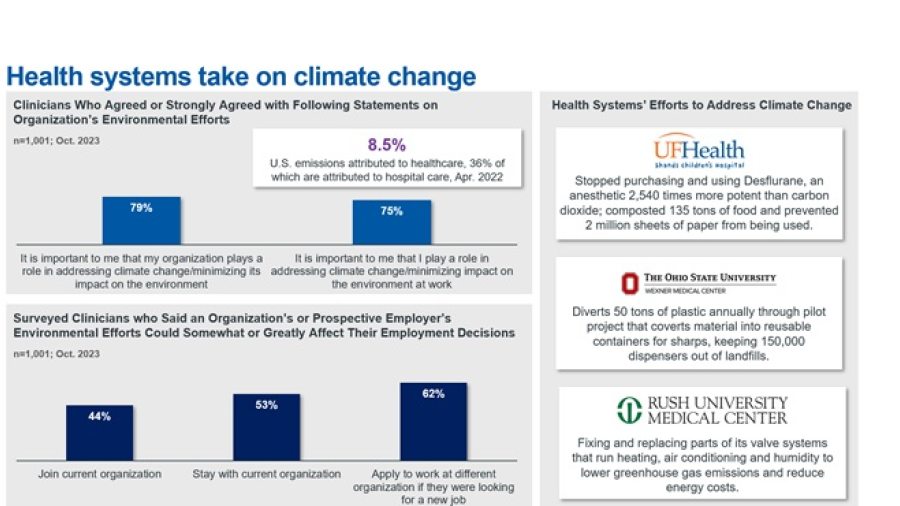
Addressing climate change a prominent goal for clinicians In honor of Earth Day this Tuesday, this week’s graphic demonstrates the importance for hospitals to address climate change. Infographic
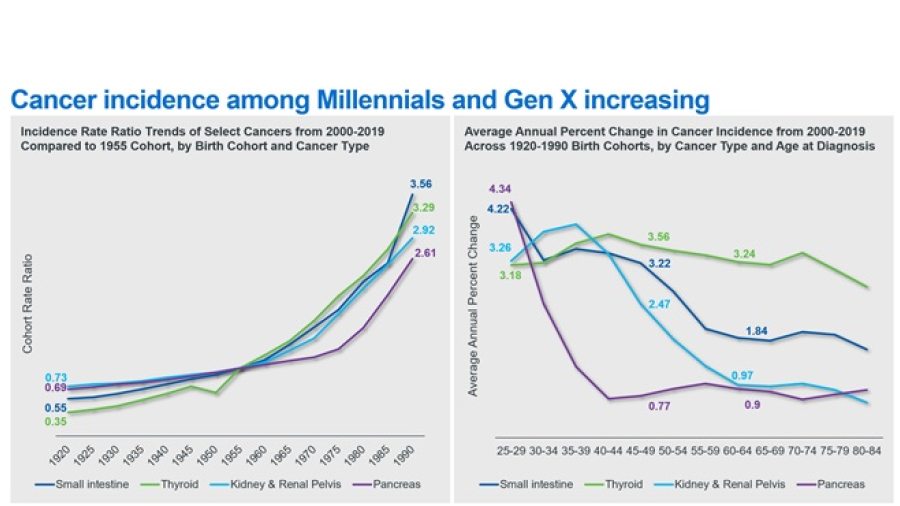
Cancer diagnoses among younger generations increasing This week’s graphic highlights data from a recent study published by The Lancet on cancer incidence trends in the United States between 2000 and 2019 among those born between 1920 and 1990. Of the 34 types of cancer studied, 17 were found to have an increased incidence among those from the Generation X and Millennial cohorts Infographic
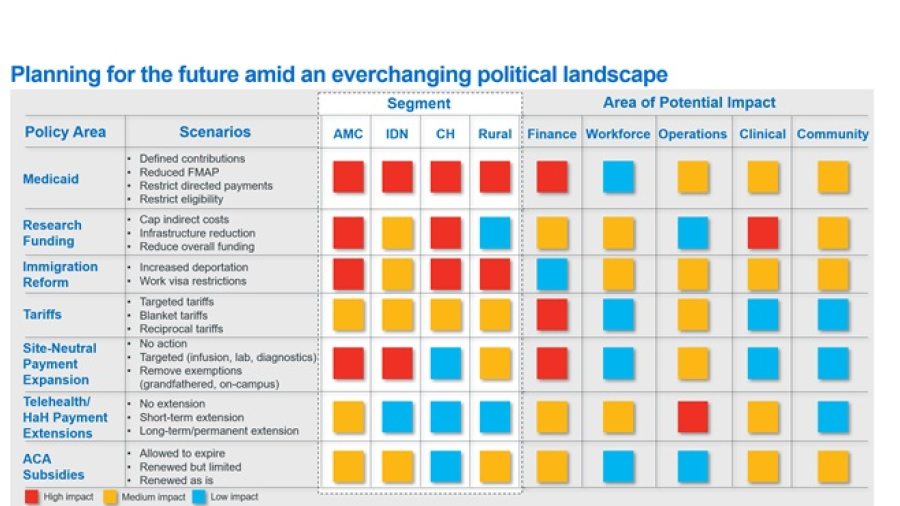
Implications of potential federal policy changes for hospitals In this week’s graphic, we highlight new analysis from our colleagues at Sg2 that illustrates a framework to help providers evaluate the implications of a changing policy landscape. Infographic
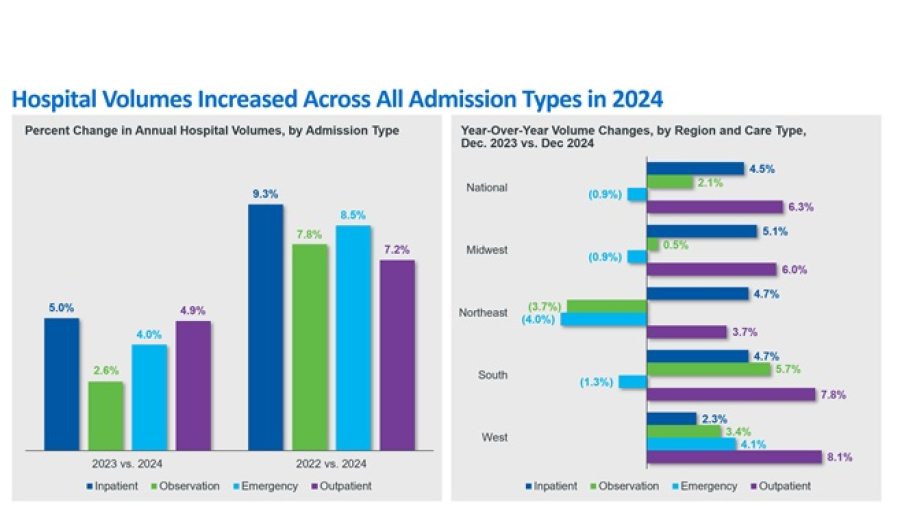
The State of Hospital Volumes The graphic highlights the most recent data from software and analytics firm Strata Decision Technology comparing 2024 hospital volumes by admission types with 2023 and 2022 volumes. Infographic
The State of Trust in Public Health in America In light of the recent confirmation of Secretary Kennedy to lead HHS and new survey data on trust in public health, this graphic highlights Americans’ declining positive perception of public health officials. Infographic