Search Sort by Newest to OldestOldest to NewestRelevanceA-ZZ-A Pagination Current page 1 Page 2 Next page › Last page Last Docs exiting traditional Medicare in greater numbers The number of physicians exiting traditional Medicare has accelerated, especially since the Covid-19 pandemic, with the annual exit rate climbing from less than 1% in 2013 to nearly 5% in 2023, a new JAMA study has found. Infographic HOPDs treat sicker, more low-income and older patients: AHA study A recent study published by the American Hospital Association found that hospital outpatient departments (HOPDs) care for more complex patients than independent physician offices. Infographic Healthcare uninsurance rates creeping up Newly published data from the U.S. Census Bureau indicate that the rate of uninsurance in the United States is rising. Infographic The rising cost of providing benefits to employees More than half of large employers intend to reduce benefits or shift costs to employees to control overall health plan costs, according to new data from Mercer. Infographic Better outcomes for surgical patients A new report shows that the difference between expected and observed mortality rates for hospitalized surgical patients continues to improve. Infographic High market concentration for Medicare Advantage insurers This week’s graphic features data from a new report from KFF highlighting how little competition there is in most markets for Medicare Advantage. Infographic A deep dive into state health scorecards This week’s graphic highlights a new report from The Commonwealth Fund with data on state-by-state health performance. Infographic Medicaid a prominent coverage provider among birthing parents In light of Medicaid cuts in the now-signed OBBB becoming law, this week’s graphic highlights a prominent use of Medicaid. Infographic Healthcare affordability declining This week’s graphic highlights new Gallup survey data and Bureau of Labor Statistics inflation data to consider growing healthcare affordability challenges. Infographic Public does not want Medicaid funding cuts As Medicaid cuts look increasingly likely per Congress’ recently-passed budget plan, this week’s graphic uses survey data from KFF to take stock of the public’s view of the program. Infographic Implications of potential federal policy changes for hospitals In this week’s graphic, we highlight new analysis from our colleagues at Sg2 that illustrates a framework to help providers evaluate the implications of a changing policy landscape. Infographic Providing Health Insurance was Less Lucrative in 2024 This week’s graphic takes stock of the 2024 financial performance of four leading insurers: Humana, Cigna, CVS and UHG. Infographic Pagination Current page 1 Page 2 Next page › Last page Last
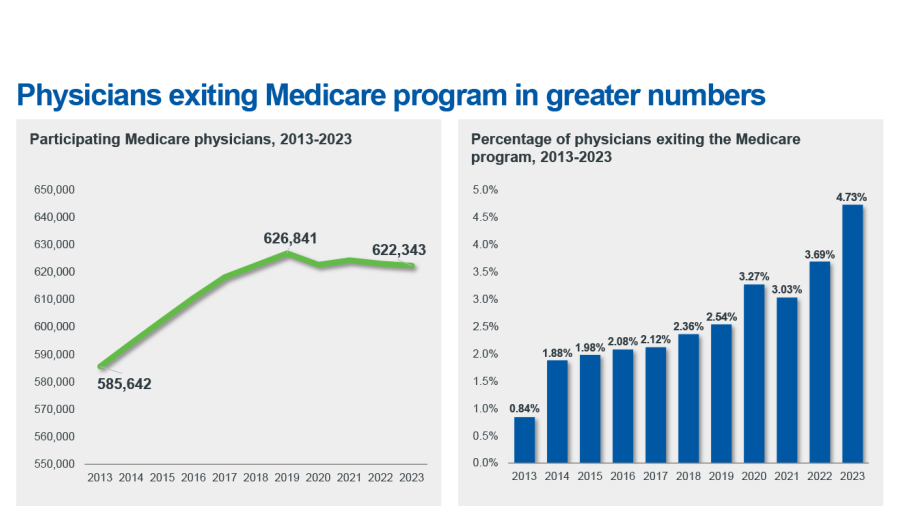
Docs exiting traditional Medicare in greater numbers The number of physicians exiting traditional Medicare has accelerated, especially since the Covid-19 pandemic, with the annual exit rate climbing from less than 1% in 2013 to nearly 5% in 2023, a new JAMA study has found. Infographic
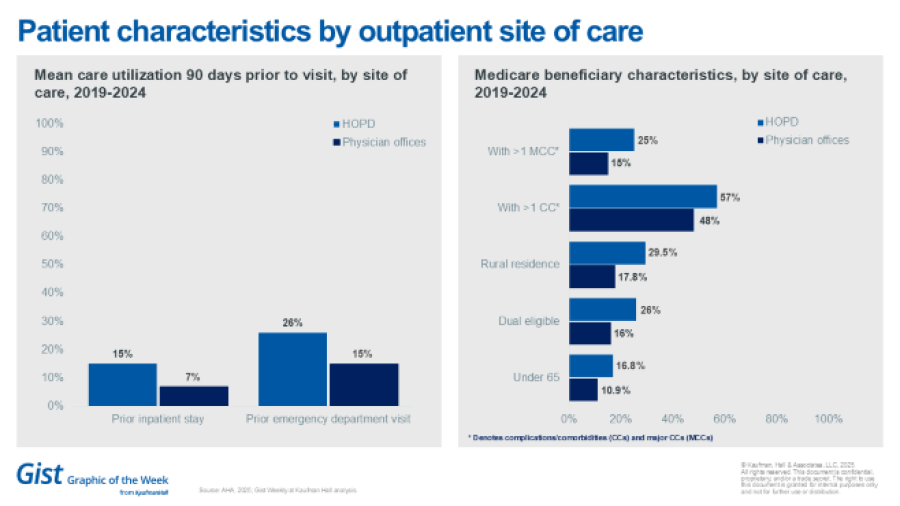
HOPDs treat sicker, more low-income and older patients: AHA study A recent study published by the American Hospital Association found that hospital outpatient departments (HOPDs) care for more complex patients than independent physician offices. Infographic
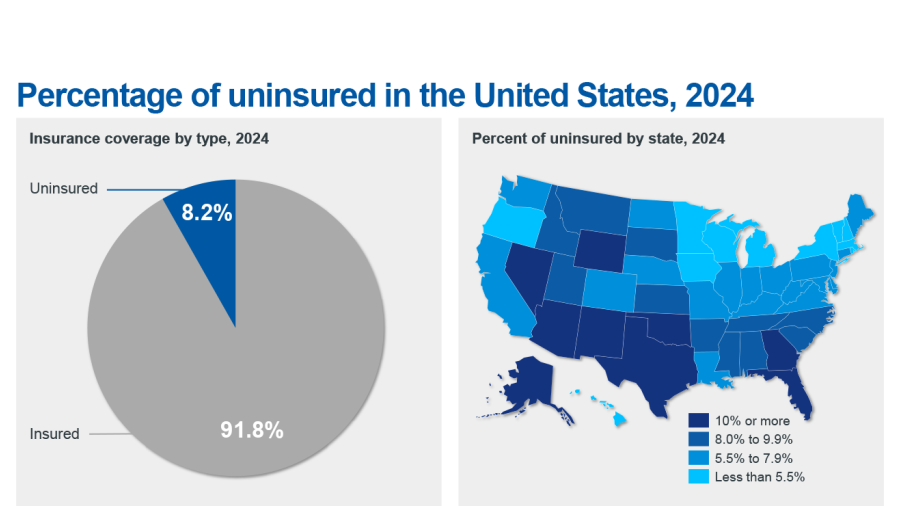
Healthcare uninsurance rates creeping up Newly published data from the U.S. Census Bureau indicate that the rate of uninsurance in the United States is rising. Infographic
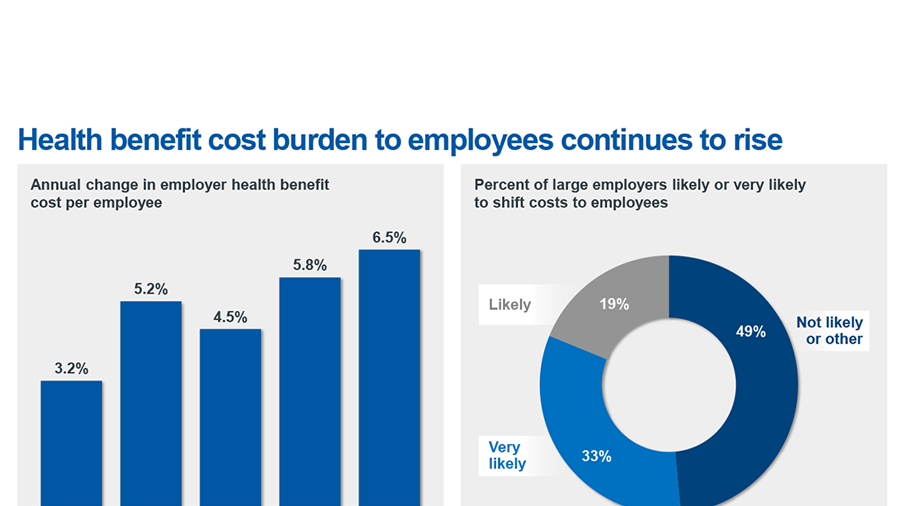
The rising cost of providing benefits to employees More than half of large employers intend to reduce benefits or shift costs to employees to control overall health plan costs, according to new data from Mercer. Infographic
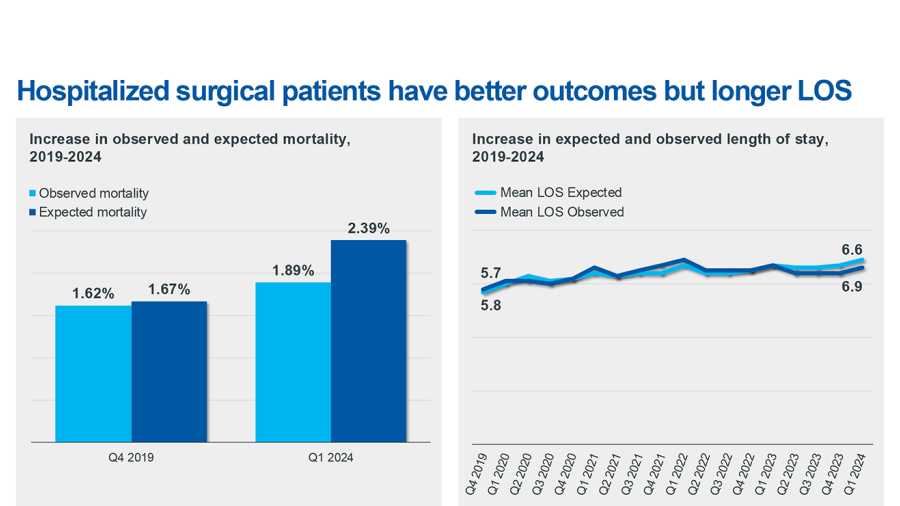
Better outcomes for surgical patients A new report shows that the difference between expected and observed mortality rates for hospitalized surgical patients continues to improve. Infographic
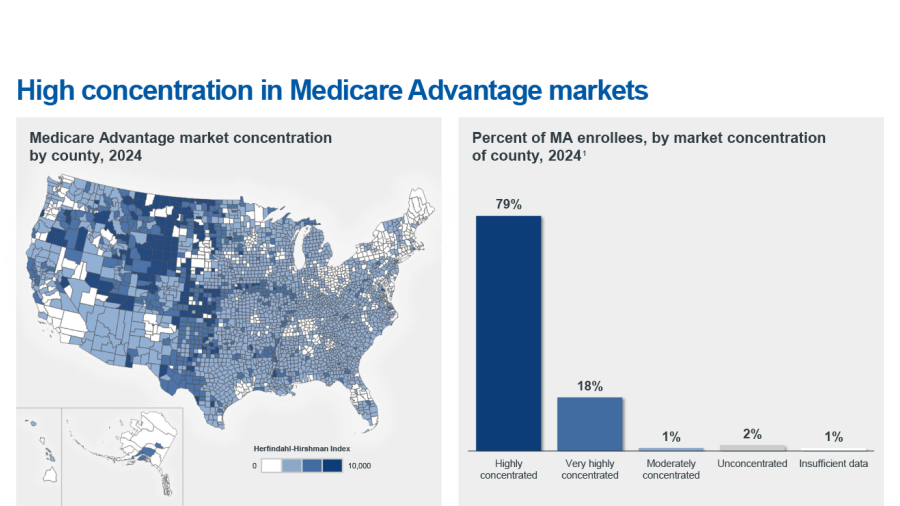
High market concentration for Medicare Advantage insurers This week’s graphic features data from a new report from KFF highlighting how little competition there is in most markets for Medicare Advantage. Infographic
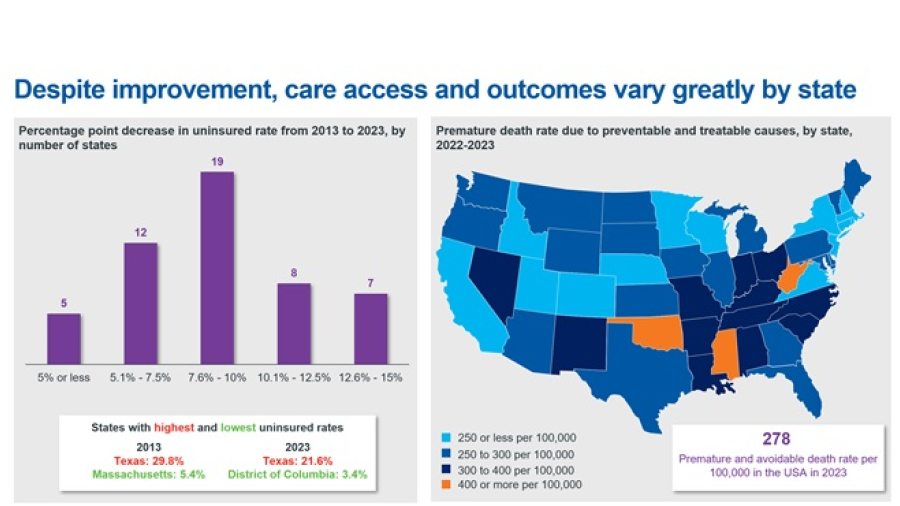
A deep dive into state health scorecards This week’s graphic highlights a new report from The Commonwealth Fund with data on state-by-state health performance. Infographic
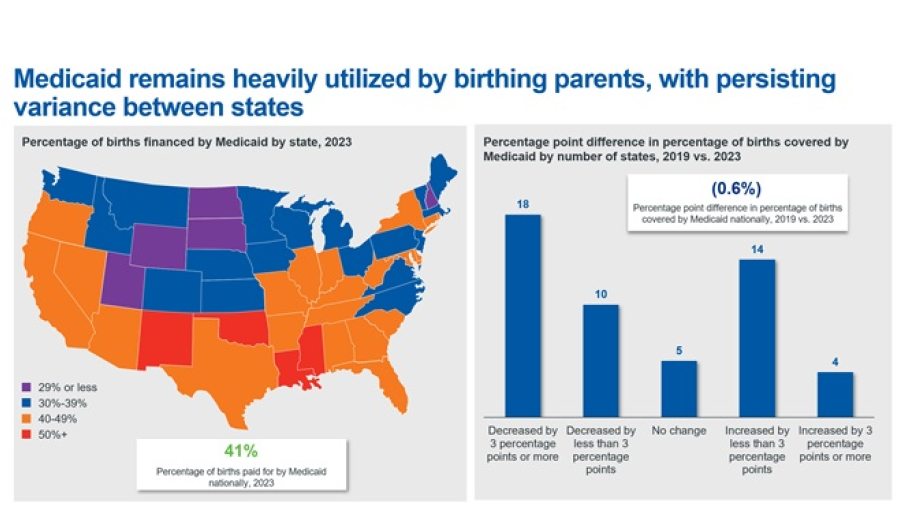
Medicaid a prominent coverage provider among birthing parents In light of Medicaid cuts in the now-signed OBBB becoming law, this week’s graphic highlights a prominent use of Medicaid. Infographic
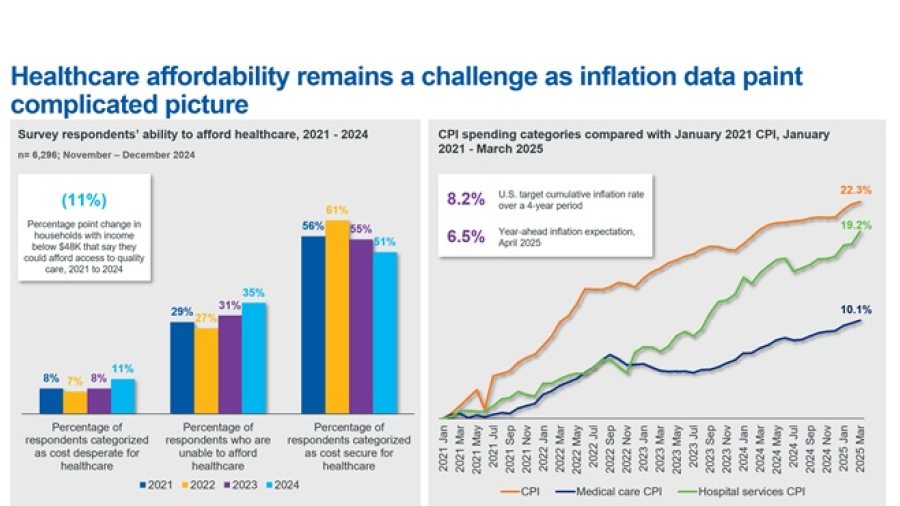
Healthcare affordability declining This week’s graphic highlights new Gallup survey data and Bureau of Labor Statistics inflation data to consider growing healthcare affordability challenges. Infographic
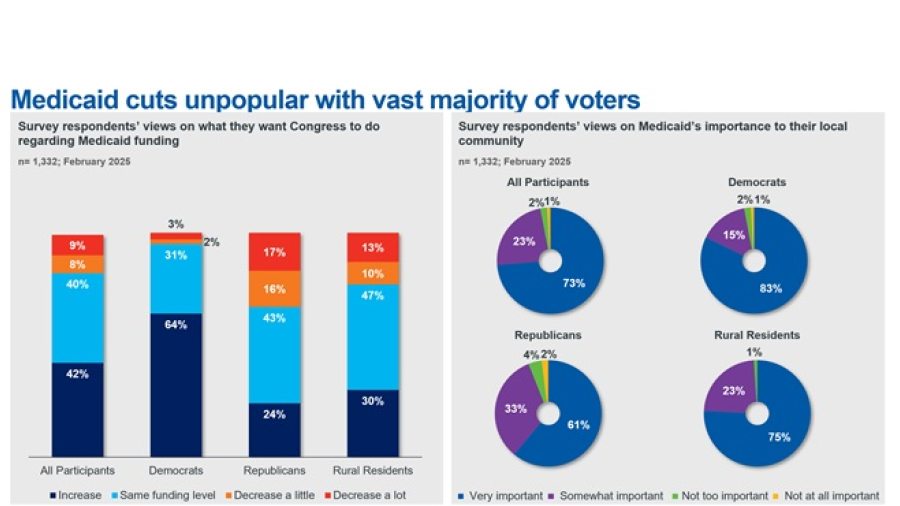
Public does not want Medicaid funding cuts As Medicaid cuts look increasingly likely per Congress’ recently-passed budget plan, this week’s graphic uses survey data from KFF to take stock of the public’s view of the program. Infographic
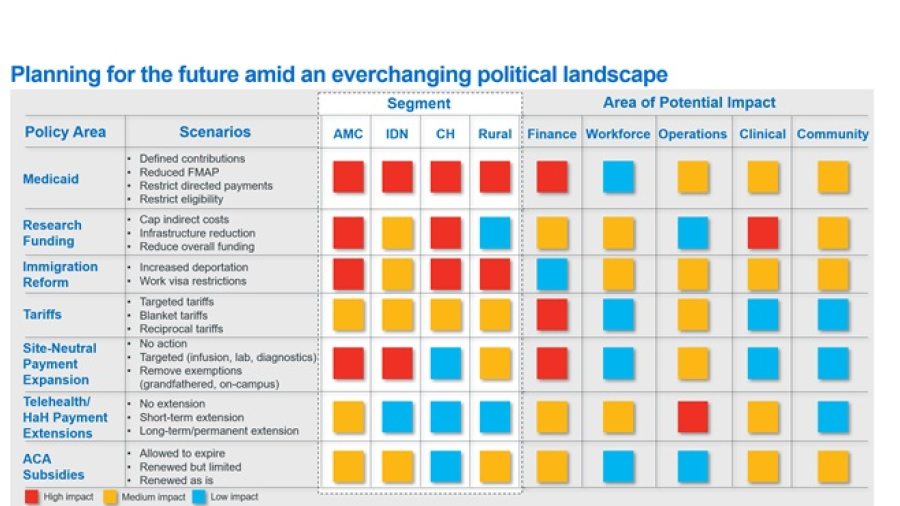
Implications of potential federal policy changes for hospitals In this week’s graphic, we highlight new analysis from our colleagues at Sg2 that illustrates a framework to help providers evaluate the implications of a changing policy landscape. Infographic
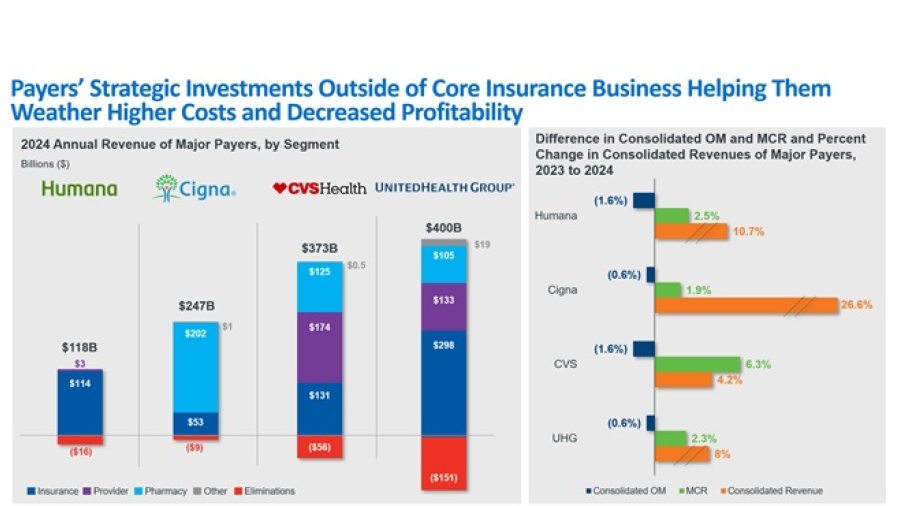
Providing Health Insurance was Less Lucrative in 2024 This week’s graphic takes stock of the 2024 financial performance of four leading insurers: Humana, Cigna, CVS and UHG. Infographic