
The nation’s hospitals and health systems continued to see gains across key metrics in May compared to dramatic losses experienced in the early months of the COVID-19 pandemic. Volumes and margins both increased compared to 2020 levels, but remain down compared to 2019. Total expenses and revenues, however, rose above both pandemic and pre-pandemic performance.
The increases came as the severity of the pandemic continued to wane. The 7-day moving average of new COVID-19 cases fell 63% over the course of the month, from 49,478 on May 1 to 18,134 on May 31, according to Centers for Disease Control and Prevention data.1 The 7-day moving average of new admissions for patients with confirmed COVID-19 fell 44%, from 4,805 on May 1 to 2,705 on May 31. Meanwhile, the pace of vaccinations dropped precipitously. The 7-day moving average of daily doses administered fell nearly 60%, from 2.3 million on May 1 to 930,703 on May 31. More than 138.5 million Americans had been fully vaccinated by month’s end.
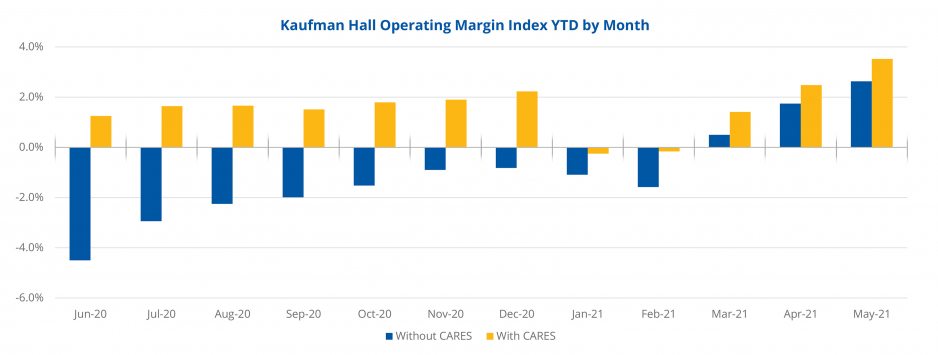
Despite increases in patient volumes—and in outpatient volumes in particular—hospitals continued to operate on narrow margins. The median Kaufman Hall hospital Operating Margin Index2 was 2.6% in May, not including federal CARES funding. With the funding, it was 3.5%. The median Operating EBITDA Margin for the month was 7.2% without CARES and 8.0% with CARES.
Compared to the first five months of 2020, Operating Margin rose 95.2% year-to-date (YTD) and Operating EBITDA Margin jumped 102.4% YTD in May, not including CARES aid. With the funding, Operating Margin was up 56.6% YTD and Operating EBITDA Margin rose 40.4% YTD.
Compared to pre-pandemic levels in the first five months of 2019, however, Operating Margin was down 20.5% YTD without CARES and down 9% YTD with CARES. Operating EBITDA Margin was down 16.7% from January-May 2021 versus January-May 2019 without CARES, and down 10.7% over the same period with the federal aid.
Increasing patient volumes contributed to the YTD margin increases, especially compared to low volumes seen with national shutdowns and restrictions on non-urgent procedures in the early months of COVID-19. While some volume metrics remained well below 2019 performance, others came close to pre-pandemic levels. Adjusted Discharges were up 9.1% YTD compared to January-May 2020, but fell 7.1% YTD compared to January-May 2019.
Adjusted Patient Days rose 14.3% YTD from 2020 to 2021, but were close to pre-pandemic performance, down 0.4% YTD compared to the first five months of 2019. Emergency Department (ED) Visits were essentially flat—down just 0.2%—compared to January-May 2020, but remained significantly below 2019 rates, down 16.1% compared to January-May 2019. Operating Room Minutes jumped 28.3% YTD from 2020, and were close to pre-pandemic levels, up just 0.8% YTD compared to 2019.
Revenues showed positive gains compared to both 2020 and 2019. Gross Operating Revenue (not including CARES) increased 18.6% YTD from 2020, and 5.9% compared to 2019 levels. Inpatient Revenue was up 13.1% YTD versus January-May 2020, and up 2.9% compared to the same period in 2019. Outpatient Revenue saw the biggest revenue increases, jumping 25.1% YTD above last year’s levels, and 6.8% above 2019 performance as demand for ambulatory services continues to rise post-pandemic.
Adjusted expenses saw some improvements compared to early 2020, but were up compared to 2019 levels. Total Expense per Adjusted Discharge was down 1.7% YTD from January-May 2020, but up 16.6% above January- May 2019. Labor Expense per Adjusted Discharge decreased 1.8% YTD compared to the first five months of 2020, but rose 16.9% YTD above 2019. Non-Labor Expense per Adjusted Discharge was down 1.7% YTD from the same period last year, but up 18.0% compared to pre-pandemic levels.
Across the U.S., initial jobless claims fell below 400,000 in May for the first time since March 2020 as the nation’s economy moved toward full reopening. In early June, Treasury Secretary Janet Yellen told Bloomberg News that higher interest rates due to a growing economy could “be a plus for society’s point of view and the Fed’s point of view,” referring to the possible impacts of President Joe Biden’s $4 trillion spending proposal. That same week, the G-7 nations reached a historic agreement on global tax reform backing a global minimum corporate tax rate of 15%.
Recent performance gains provide positive signs of recovery for the nation’s hospitals and health systems, but there still is a ways to go. While the improvements over the devastating lows of early 2020 are to be expected, comparisons to 2019 offer a clear view of how hospitals are faring relative to pre-pandemic levels.