
Benchmark yield curves are flat to inverted but long rates remain historically attractive. Public market not-for-profit healthcare issuance is light, reflecting two previous years of strong capital formation as well as the constrictive impact of the credit headwinds confronting borrowers.
|
1 |
5 |
10 |
30 |
|
|
Aug 19 - UST |
3.25% |
3.11% |
2.98% |
3.22% |
|
v. Aug 5 |
-2 bps |
+14 bps |
+14 bps |
+14 bps |
|
Aug 19 - MMD* |
2.15% |
2.20% |
2.48% |
3.11% |
|
v. Aug 5 |
+56 bps |
+38 bps |
+24 bps |
+20 bps |
|
Aug 19 - MMD/UST |
66.15% |
70.74% |
83.22% |
96.52% |
|
v. Aug 5 |
+17.53% |
+9.46% |
+4.35% |
+2.04% |
|
*Note: MMD assumes 5.00% coupon |
||||
SIFMA reset this week at 1.79%, which is approximately 76% of 1-Month LIBOR and represents a +11 basis point adjustment versus the August 3 reset.
There’s Something Happening Here
The phrase “may you live in interesting times” is often used to suggest the hopeful idea that overcoming challenges is part of an exciting, good life. The reality is that the phrase is the English translation of a Chinese curse, in which a blessed life takes place in serene and peaceful times while an interesting life is anything but. Sad to say, we crossed the interesting times threshold a while back. We confront relentless disruption and fragmentation, which makes it difficult to find consensus about where we are and where we need to go. Just this week, headlines in The Wall Street Journal included the following:
- China’s Growth Slowed Across All Fronts in July, Prompting Unexpected Rate Cut
- U.K. Inflation Tops 10%, Highest of Rich Nations
- Fed Sees Need for More Rate Rises, Less Certainty Over Destination
- Wall Street Bets the Fed Is Bluffing in High-Stakes Inflation Game
Is the problem inflation or slowing growth or both? What is the global impact of different local fiscal and monetary policies? In the words of Buffalo Springfield, “there’s something happening here but what it is ain’t exactly clear.”
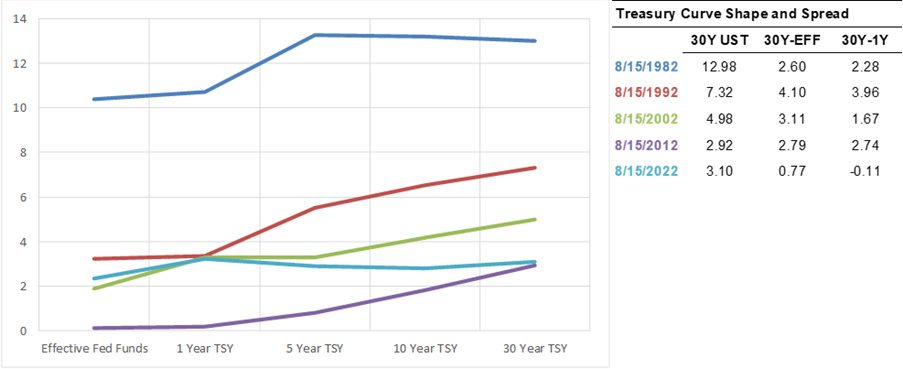
Fed Funds and Treasury Rates: The world’s primary rates market models the inflation versus growth tension. The Fed mantra is higher rates, but the long end of the Treasury market reflects a downstream growth expectation that will be weak enough to produce low rates (presumably after inflation is whipped). The result is a modest 77 basis point spread between 30-year Treasuries and Effective Fed Funds and an 11 basis point inversion between 30-year Treasuries and 1-year Treasuries. It’s a conflicted yield curve, but the equally substantive message remains that from an historical perspective, benchmark rates across the curve—even at the elevated short end and certainly at the long end—remain accommodative. The Treasury market serves a lot of roles in the global capital markets, but there is a disconnect between the Fed’s view that short rates will move higher and investors accepting a 77 basis point spread to extend duration.
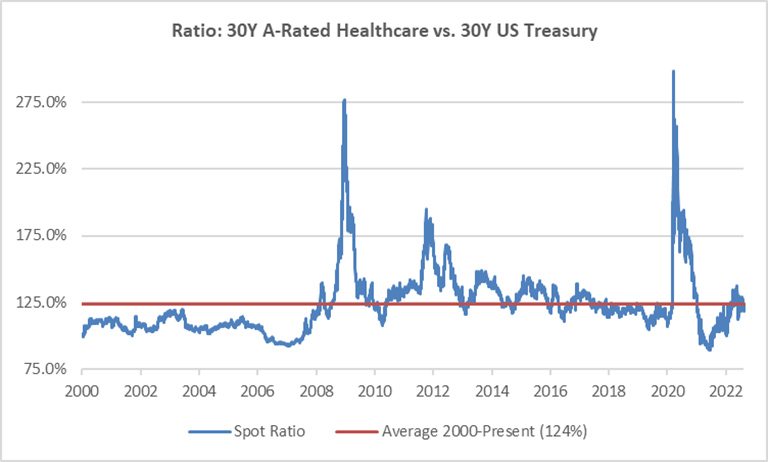
Tax-Exempt Healthcare Funding: The story carries over into the tax-exempt financing world. Data from TM3 shows that 30-year A-rated healthcare yields (MMD plus credit spread) have moved higher as a percentage of 30-year Treasuries, but that current ratios are in line with historical averages. Ratios are up sharply versus 2021 lows, which makes it feel like tax-exempt funding levels are adverse. But, favorable 30-year Treasury rates paired with average tax-exempt ratios confirm that it is still an historically attractive time to access long-term tax-exempt capital. The first question is whether statistical indices appropriately reflect where new issues can successfully clear the market on any given day. The second question is whether current ratios would hold up if issuance activity increased; the ratio market has likely been buoyed by reduced issuance, especially since significant resources have moved out of the municipal market in search of more stability or better returns. Forward issuance calendars remain light, so it doesn’t seem like ratios will get tested in the near term, but it also feels like most credit markets (as opposed to the Treasury rates market) are neither particularly broad nor deep nor reliable.
Healthcare Credit: Year-to-date upgrades at each of the three rating agencies have outpaced downgrades—by our count, the cumulative score is 32 to 26—and most actions continue to be affirmations. But earlier this week, Fitch Ratings updated its healthcare sector outlook to “Deteriorating” and highlighted the risk that we may be transitioning into a period of “elevated downgrades and negative outlook pressure.” Fitch’s commentary is consistent with messaging coming out of Moody’s and S&P, based on what seems to be a consensus expectation that performance headwinds will last well into 2023 (or beyond). Throughout the pandemic, the rating thesis was that strong and liquid balance sheets created a credit anchor that provided the time and space to rationalize “rating through the cycle.” Unfortunately, the landing point of the COVID cycle seems to be a profoundly challenged operating model paired with escalating balance sheet vulnerability due to reduced organic cash flow generation and volatile investment markets. Operations are back as the rating centerpiece; balance sheet remains a buffer, but defending a rating position requires demonstrating that you can progress through the operating and strategic restructuring needed to generate sustaining levels of operating and cash flow margin.
Trending in Healthcare Treasury and Capital Markets is a biweekly blog providing updates on changes in the capital markets and insights on the implications of industry trends for Treasury operations, authored by Kaufman Hall Managing Director Eric Jordahl.