Hospitals and health systems across the country closed a tumultuous 2020 with record levels of COVID-19 related hospitalizations and continued poor performance across most metrics in December. Hospital margins fell significantly with declining volumes and outpatient revenues, and escalating expenses compared to 2019.
COVID-related hospitalizations—which have steadily increased since early September—climbed to a December high of 125,423 nationwide at month’s end, upmore than 30% since late November, according to The COVID Tracking Project. Overall hospitalization increases were especially high in states such as California, Florida, New York, and Texas, as well as across most Southern states. Adjusted for population, the West had the highest COVID hospitalization rate at 421 for every 1 million people as of Dec. 30, followed by the Northeast at 392 per million, and the South at 387 per million.
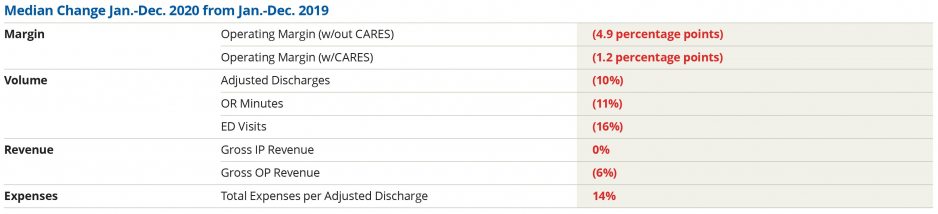
The pressures of the pandemic continued to strain hospital resources. The median Kaufman Hall hospital Operating Margin Index* for all of 2020 was 0.3%, not including federal CARES funding. With the funding, it was 2.7%. The median 2020 Operating EBITDA Margin was 5.1% without CARES and 7.6% with CARES. Operating Margin was down 55.6% (4.9 percentage points) for January through December without CARES, and down 16.6% (1.2 percentage points) with CARES. Operating EBITDA Margin fell 34.8% (4.9 percentage points) in 2020 without the federal funding and was down 7.9% (1.2 percentage points) with CARES.
While margins rose from November to December, they remained well below 2019 levels. Operating Margin declined 18% or 2.4 percentage points compared to December 2019 but increased 21.2% or 2.2 percentage points month-over-month without CARES. Operating EBITDA Margin was down 14.7% (2.4 percentage points) year-over-year (YOY) but up 8.5% (1.5 percentage points) month-over-month without CARES. With the federal aid, Operating Margin was down 11.7% or 1.5 percentage points YOY, and Operating EBITDA Margin was down 9.5% or 1.7 percentage points.
Inpatient volumes surpassed 2019 levels for a second consecutive month due to rising COVID-19 hospitalizations, with Patient Days up 4.5% YOY. Discharges, however, remained down 4.3% compared to December 2019 and down 7.3% year-to-date (YTD), reflecting a continued increase in higher acuity patients. Average Length of Stay (LOS) rose 11% YOY and 6.6% YTD, but decreased about 1% month-over-month.
Emergency Department (ED) Visits saw the biggest YTD volume declines, falling 16.2% in 2020 compared to 2019. In December, ED Visits were down 22.6% YOY, but increased slightly 1% month-over-month. Operating Room Minutes also fell significantly—down 10.5% for the 12 months of 2020—and were down 3.9% YOY in December, but up 5.8% compared to November.
Gross Operating Revenue (not including CARES) dropped 3.1% over the course of the calendar year, but rose 4.1% YOY in December. The pandemic continued to drag down Outpatient Revenues, as many consumers remained reluctant to visit healthcare facilities for non-urgent needs. Outpatient Revenue fell nearly 6% in 2020, and was essentially flat YOY in December. Inpatient Revenue was up just 0.3% YTD, but rose 8.9% YOY for the month of December.
The combination of declining outpatient volumes and increasing inpatient volumes drove the Inpatient/Outpatient Adjustment Factor down 3.2% YTD and down 4.2% YOY. Bad Debt and Charity as a Percent of Gross fell 5.9% in 2020 and 17.1% YOY in December.
Despite lower overall volumes, hospitals continued to see expenses mount as they bore the high costs of caring for COVID-19 cases and other high acuity patients. Total Expense per Adjusted Discharge and Labor Expense per Adjusted Discharge both increased 14.4% throughout 2020 and 19% YOY in December.
Non-Labor Expense per Adjusted Discharge was up 14.2% for the calendar year and 20.8% YOY in December, due in large part to rising drug and purchased service expenses. Drug Expense per Adjusted Discharge jumped 16.7% throughout 2020 and 44.2% YOY in December, while Purchased Service Expense per Adjusted Discharge was up 16.4% YTD and 19.4% YOY. Supply Expense per Adjusted Discharge also was high, rising 13% for the year and 26.5% YOY for the month.
The COVID-19 crisis continued to drive instability in the broader economy. Equities remained volatile throughout the month amid Congressional turmoil regarding additional stimulus aid and uncertainty around vaccine rollouts. The Federal Reserve indicated in December that it would continue large purchases of treasury and mortgage-backed securities, and retain the near-zero federal funds rate until inflation and unemployment consistently meet targets. Delay of government relief to small businesses and rising infections contributed to a loss of 140,000 jobs in December. Even so, the S&P 500 reached an all-time high of 3,756 on December 30.
The next few months are expected to be rough, as the nation’s hospitals and health systems cope with rising COVID-19 infections as people congregate indoors over the colder winter months, and as the new, more contagious variant of the virus spreads nationwide. The CDC projects the new variant could be the most prevalent COVID-19 strain in the U.S. by March.
Hospitals already saw COVID-19 hospitalizations jump 6% between December 31 and January 7, likely due to infections from holiday related gatherings. As of January 7, hospitals reported that 79% of intensive care beds were occupied nationwide, up 2 percentage points from just one week prior. Kaufman Hall will continue to monitor the effects of the pandemic on the nation’s hospitals and health systems through these turbulent times.
* Note: The Kaufman Hall Hospital Operating Margin and Operating EBITDA Margin Indices are comprised of the national median of our dataset adjusted for allocations to hospitals from corporate, physician, and other entities.