Margin
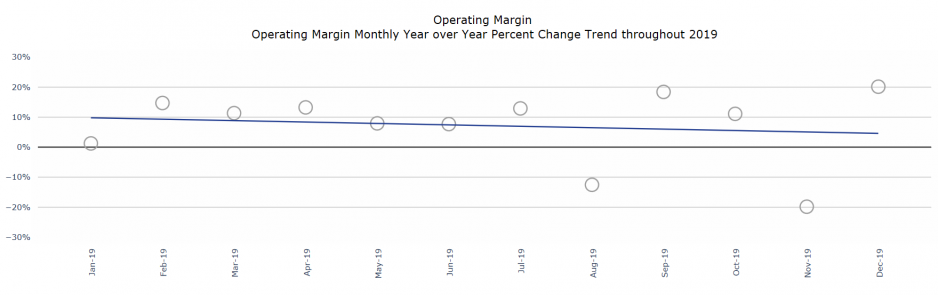
Hospitals nationwide saw improved margin performance in 2019 over 2018. Operating Earnings Before Interest, Taxes, Depreciation, and Amortization (EBITDA) rose 2.0 percent or 39 basis points (bps), while Operating Margin rose 7.4 percent or 78 bps. Contributing factors include modest revenue gains and some volume increases, despite rising expenses.
Looking at overall trends, 2019 Operating EBITDA Margin performance generally was above 2018 levels, but the gap narrowed toward the end of the year. While most months saw favorable year-over-year performance, margins declined significantly in August and November. Operating Margin saw favorable performance nine months, but flat-to declining performance three months.
Figure 1: Operating Margin Monthly Year over Year Percentage Change Trend Throughout 2019
Volume
National volume indicators showed mixed performance in 2019, with year-over-year increases for most metrics, but a majority performing below budget. Adjusted Patient Days saw the greatest year-over-year increase at 2.5 percent or 815.2 bps, but was up just 0.3 percent to budget. Adjusted Discharges were up 0.7 percent or 43.2 bps year over year, but fell below budget. Discharges and Emergency Department (ED) Visits showed slight year-over-year decreases, while Average Length of Stay (LOS) and Operating Room (OR) Minutes both rose about 2.0 percent.
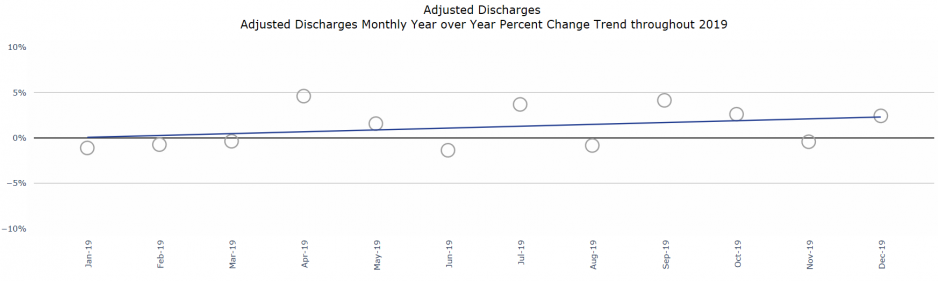
Overall, the nation’s hospitals saw a trend of modest increases in Discharges and Adjusted Discharges throughout 2019. Adjusted Discharges peaked in April, but dipped below 2018 performance six months. Year-over-year performance on Adjusted Patient Days rose steadily for most of the year.
Figure 2: Adjusted Discharges Monthly Year over Year Percentage Change Trend Throughout 2019
Revenue
The nation’s hospitals saw favorable revenue performance in 2019 compared to 2018. Net Patient Service Revenue (NPSR) per Adjusted Discharge rose 3.7 percent or 326.0 bps year over year and was up slightly to budget, while NPSR per Adjusted Patient Day rose 1.5 percent or 25.9 bps and was on par with budget. The Inpatient/Outpatient (IP/OP) Adjustment Factor was up year over year and to budget, while Bad Debt and Charity as a Percent of Gross rose 1.0 percent, and was significantly above budget.
The trendline shows NPSR per Adjusted Discharge consistently above 2018 levels, but slight, steady declines in that performance throughout 2019. NPSR per Adjusted Patient Day saw a similar pattern, performing above 2018 levels for 10 of 12 months, but steadily decreasing in its positive variance throughout 2019.
Expense
Hospitals across the country saw expenses increase in 2019 compared to 2018. Total Expense per Adjusted Discharge rose 3.4 percent or 294.5 bps year over year and was 1.4 percent to budget. Labor Expense per Adjusted Discharge was up 2.6 percent or 91.0 bps for the year, while Full-Time Equivalents (FTEs) per Adjusted Occupied Bed (AOB) was the only expense metric to show a year-over-year decline. Non-Labor Expense per Adjusted Discharge was up 4.0 percent or 197.6 bps year over year, due to increases in Supply, Drug, and Purchased Services Expenses per Adjusted Discharge.
The overall trend shows Total Expense per Adjusted Discharge consistently above 2018 levels throughout most of 2019. Labor Expense per Adjusted Discharge rose steadily, while Non-Labor Expense per Adjusted Discharge saw a slight decline in year-over-year variance throughout the year.
Figure 3: Labor Expense per Adjusted Discharge Monthly Year Over Year Percentage Change Trend Throughout 2019